Elementary Statistics: A Step By Step Approach
10th Edition
ISBN: 9781259755330
Author: Allan G. Bluman
Publisher: McGraw-Hill Education
bartleby

Videos

Textbook Question
Book Icon
Chapter 3.4, Problem 16E

Size of Dams These data represent the volumes in cubic yards of the largest dams in the United States and in South America. Construct a boxplot of the data for each region and compare the distributions.

United States South America

125,628

92,000

78,008

77,700

66,500

62,850

52,435

50,000

311,539

274,026

105,944

102,014

56,242

46,563

Expert Solution & Answer
Check Mark
To determine

The boxplot of the given data and comparison of the distribution.

Answer to Problem 16E

The boxplot for the capacity of dams in the United States is shown below,
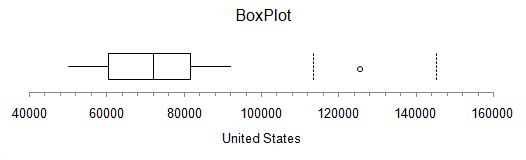
Elementary Statistics: A Step By Step Approach, Chapter 3.4, Problem 16E , additional homework tip  1

Fig (1)

The boxplot for the capacity of dams in the South America is shown below,
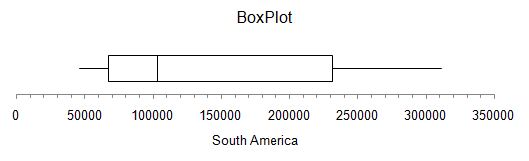
Elementary Statistics: A Step By Step Approach, Chapter 3.4, Problem 16E , additional homework tip  2

Fig (2)

The range and variation of the capacity of the dams in South America is larger than the capacity of the dams in United Stated.

Explanation of Solution

Given info:

The data of the capacity of dams in the United States and the South America is shown in the table below.

United States South America
125628 311539
92000 274026
78008 105944
77700 102014
66500 56242
62850 46563
52435
50000

Calculation:

The boxplot is used to graphically depict groups of numerical data through their quantities.

Arrange the densities of dams in the United States in ascending order as shown below.

United States
50000
52435
62850
66500
77700
78008
92000
125628

The minimum capacity of the dam from the above table is 50000 and the maximum capacity of the dam is 125628.

The number of data in the table is 8.

The formula to calculate the median for even data is shown below.

Median=(n2)thterm+(n2+1)thterm2

The total number of terms in the data is 8 so, substitute 8 for n in the above formula.

Median=(82)thterm+(82+1)thterm2=(4)thterm+(5)thterm2 (1)

4thterm from the arranged data is 66500 and the 5thterm is 77700.

Substitute 66500 for 4thterm and 77700 for 5thterm in equation (1).

4thterm+5thterm2=66500+777002=72,100

Thus, the median of the data is 72,100.

Software procedure:

Step-by-step procedure to construct boxplot by using Excel add-in (MegaStat).

  • First select the data for which boxplot is obtained.
  • Click on Add-Ins option in the top.
  • Click on MegaStat option on the left side of the screen and then click on descriptive statistics.
  • Select the boxplot option then in input range, select the data cells and then click ok.

Observation:

Since median falls to the right of the centre of the box thus the distribution is slightly negatively skewed.

Now, arrange the data of densities of dams in the South America in ascending order as shown below.

South America
46563
56242
102014
105944
274026
311539

The minimum capacity of the dam from the above table is 46563 and the maximum capacity of the dam is 311539.

The number of data in the table is 6.

The formula to calculate the median for even data is shown below.

Median=(n2)thterm+(n2+1)thterm2

The total number of terms in the data is 6 so, substitute 6 for n in the above formula.

Median=(62)thterm+(62+1)thterm2=(3)rdterm+(4)thterm2 (2)

3rdterm from the arranged data is 102014 and the 4thterm is 105944.

Substitute 102014 for 3rdterm and 105944 for 4thterm in equation (2).

3rdterm+4thterm2=102014+1059442=103,979

Thus, the median of the data is 103,979.

Software procedure:

Step-by-step procedure to construct boxplot by using Excel add-in (MegaStat).

  • First select the data for which boxplot is obtained.
  • Click on Add-Ins option in the top.
  • Click on MegaStat option on the left side of the screen and then click on descriptive statistics.
  • Select the boxplot option then in input range, select the data cells and then click ok.

Observation:

Since median falls to the left of the centre of the box thus the distribution is slightly positively skewed.

The range and variation of the capacity of the dams in South America is larger than the capacity of the dams in United Stated.

Want to see more full solutions like this?

Subscribe now to access step-by-step solutions to millions of textbook problems written by subject matter experts!

Chapter 3 Solutions

Elementary Statistics: A Step By Step Approach

Ch. 3.1 - Foreign Workers The number of foreign workers...Ch. 3.1 - Distances of Stars Of the 25 brightest stars, the...Ch. 3.1 - Contest Spelling Words The last words given and...Ch. 3.1 - Wind Speeds The data show the maximum wind speeds...Ch. 3.1 - Hourly Compensation for Production Workers The...Ch. 3.1 - Points in Rose Bowl Games The data show the number...Ch. 3.1 - Percentage of Foreign-Born People The percentage...Ch. 3.1 - Percentage of College-Educated Population over 25...Ch. 3.1 - Net Worth of Corporations These data represent the...Ch. 3.1 - Specialty Coffee Shops A random sample of 30...Ch. 3.1 - Commissions Earned This frequency distribution...Ch. 3.1 - Children of U.S. Presidents The data show the...Ch. 3.1 - Enrollments for Selected Independent Religiously...Ch. 3.1 - Automobile Selling Prices Find the weighted mean...Ch. 3.1 - Fat Grams Using the weighted mean, find the...Ch. 3.1 - Diet Cola Preference A recent survey of a new diet...Ch. 3.1 - Costs of Helicopters The costs of three models of...Ch. 3.1 - Final Grade An instructor grades exams, 20%; term...Ch. 3.1 - Final Grade Another instructor gives four 1-hour...Ch. 3.1 - For these situations, state which measure of...Ch. 3.1 - Describe which measure of central tendencymean,...Ch. 3.1 - What types of symbols are used to represent sample...Ch. 3.1 - A local fast-food company claims that the average...Ch. 3.1 - If the mean of five values is 64, find the sum of...Ch. 3.1 - If the mean of five values is 8.2 and four of the...Ch. 3.1 - Find the mean of 10, 20, 30, 40, and 50. a. Add 10...Ch. 3.1 - Harmonic Mean The harmonic mean (HM) is defined as...Ch. 3.1 - Geometric Mean The geometric mean (GM) is defined...Ch. 3.1 - Quadratic Mean A useful mean in the physical...Ch. 3.1 - Median for Grouped Data An approximate median can...Ch. 3.2 - Blood Pressure The table lists means and standard...Ch. 3.2 - What is the relationship between the variance and...Ch. 3.2 - Why might the range not be the best estimate of...Ch. 3.2 - What are the symbols used to represent the...Ch. 3.2 - What are the symbols used to represent the sample...Ch. 3.2 - Why is the unbiased estimator of variance used?Ch. 3.2 - The three data sets have the same mean and range,...Ch. 3.2 - Traveler Spending The data show the traveler...Ch. 3.2 - Cigarette Taxes The increases (in cents) in...Ch. 3.2 - Prob. 9ECh. 3.2 - Size of U.S. States The total surface area (in...Ch. 3.2 - Multiple Births The numbers of various multiple...Ch. 3.2 - Starting Teachers Salaries Starting teachers...Ch. 3.2 - Ages of U.S. Astronaut Candidates The average age...Ch. 3.2 - Times Spent in Rush-Hour Traffic A sample of 12...Ch. 3.2 - Laws Passed The data show the number of public...Ch. 3.2 - Passenger Vehicle Deaths The number of people...Ch. 3.2 - Annual Precipitation Days The number of annual...Ch. 3.2 - Use the data from Exercises 7, 15, and 17...Ch. 3.2 - Pupils Per Teacher The following frequency...Ch. 3.2 - Automotive Fuel Efficiency Thirty automobiles were...Ch. 3.2 - Murders in Cities The data show the number of...Ch. 3.2 - Reaction Times In a study of reaction times to a...Ch. 3.2 - FM Radio Stations A random sample of 30 states...Ch. 3.2 - Murder Rates The data represent the murder rate...Ch. 3.2 - Waterfall Heights The frequency distribution shows...Ch. 3.2 - Baseball Team Batting Averages Team batting...Ch. 3.2 - Missing Work The average number of days that...Ch. 3.2 - Suspension Bridges The lengths (in feet) of the...Ch. 3.2 - Hospital Emergency Waiting Times The mean of the...Ch. 3.2 - Ages of Accountants The average age of the...Ch. 3.2 - Using Chebyshevs theorem, solve these problems for...Ch. 3.2 - The mean of a distribution is 20 and the standard...Ch. 3.2 - In a distribution of 160 values with a mean of 72,...Ch. 3.2 - Calories in Bagels The average number of calories...Ch. 3.2 - Time Spent Online Americans spend an average of 3...Ch. 3.2 - Solid Waste Production The average college student...Ch. 3.2 - Sale Price of Homes The average sale price of...Ch. 3.2 - Trials to Learn a Maze The average of the number...Ch. 3.2 - Farm Sizes The average farm in the United States...Ch. 3.2 - Citrus Fruit Consumption The average U.S. yearly...Ch. 3.2 - SAT Scores The national average for mathematics...Ch. 3.2 - Work Hours for College Faculty The average...Ch. 3.2 - Prices of Musical Instruments The average price of...Ch. 3.2 - Hours of Employment The mean and standard...Ch. 3.2 - Prob. 45ECh. 3.2 - Bonuses The mean and standard deviation of the...Ch. 3.2 - Serum Cholesterol Levels For this data set, find...Ch. 3.2 - Ages of Consumers For this data set, find the mean...Ch. 3.2 - Prob. 49ECCh. 3.2 - Use this data set: 10, 20, 30, 40, 50 a. Find the...Ch. 3.2 - Mean Deviation The mean deviation is found by...Ch. 3.2 - Pearson Coefficient of Skewness A measure to...Ch. 3.2 - All values of a data set must be within sn1 of the...Ch. 3.3 - Determining Dosages In an attempt to determine...Ch. 3.3 - What is a z score?Ch. 3.3 - Define percentile rank.Ch. 3.3 - What is the difference between a percentage and a...Ch. 3.3 - Define quartile.Ch. 3.3 - What is the relationship between quartiles and...Ch. 3.3 - What is a decile?Ch. 3.3 - How are deciles related to percentiles?Ch. 3.3 - To which percentile, quartile, and decile does the...Ch. 3.3 - Vacation Days If the average number of vacation...Ch. 3.3 - Age of Senators The average age of Senators in the...Ch. 3.3 - Marriage Age for Females The mean age at which...Ch. 3.3 - Teachers Salary The average teachers salary in a...Ch. 3.3 - Test Scores Which is a better relative position, a...Ch. 3.3 - College and University Debt A student graduated...Ch. 3.3 - Annual Miles Driven The average miles driven...Ch. 3.3 - Which score indicates the highest relative...Ch. 3.3 - The data show the population (in thousands) for a...Ch. 3.3 - College Room and Board Costs Room and board costs...Ch. 3.3 - Achievement Test Scores The data shown represent...Ch. 3.3 - Airplane Speeds The airborne speeds in miles per...Ch. 3.3 - Average Weekly Earnings The average weekly...Ch. 3.3 - Test Scores Find the percentile rank for each test...Ch. 3.3 - Hurricane Damage Find the percentile rank for each...Ch. 3.3 - Test Scores Find the percentile rank for each test...Ch. 3.3 - Taxes The data for a recent year show the taxes...Ch. 3.3 - Medical Marijuana 2015 Sales Tax: The data show...Ch. 3.3 - Gold Reserves The data show the gold reserves for...Ch. 3.3 - Police Calls in Schools The number of incidents in...Ch. 3.3 - Check each data set for outliers. a. 46, 28, 32,...Ch. 3.3 - Check each data set for outliers. a. 88, 72, 97,...Ch. 3.3 - Another measure of the average is called the...Ch. 3.3 - An employment evaluation exam has a variance of...Ch. 3.3 - A particular standardized test has scores that...Ch. 3.4 - Applying the Concepts 34 The Noisy Workplace...Ch. 3.4 - For Exercises 16, identify the five-number summary...Ch. 3.4 - For Exercises 16, identify the five-number summary...Ch. 3.4 - For Exercises 16, identify the five-number summary...Ch. 3.4 - For Exercises 16, identify the five-number summary...Ch. 3.4 - For Exercises 16, identify the five-number summary...Ch. 3.4 - For Exercises 16, identify the five-number summary...Ch. 3.4 - For Exercises 710, use each boxplot to identify...Ch. 3.4 - For Exercises 710, use each boxplot to identify...Ch. 3.4 - For Exercises 710, use each boxplot to identify...Ch. 3.4 - For Exercises 7-10. use each boxplot to identify-...Ch. 3.4 - School Graduation Rates The data show a sample of...Ch. 3.4 - Innings Pitched Construct a boxplot for the...Ch. 3.4 - Population of Colonies The data show the...Ch. 3.4 - Visitors Who Travel to Foreign Countries Construct...Ch. 3.4 - Areas of Islands The data show the sizes in square...Ch. 3.4 - Size of Dams These data represent the volumes in...Ch. 3.4 - Largest Dams The data show the heights (in feet)...Ch. 3.4 - Number of Tornadoes A four-month record for the...Ch. 3.4 - Unhealthy Smog Days A modified boxplot can be...Ch. 3 - Bank Failures The data show the number of bank...Ch. 3 - Shark Attacks The number of shark attacks and...Ch. 3 - AID: 1825 | 29/05/2018 3. Systolic Blood Pressure...Ch. 3 - SAT Scores The mean SAT math scores for selected...Ch. 3 - Households of Four Television Networks A survey...Ch. 3 - Investment Earnings An investor calculated these...Ch. 3 - Confirmed Measles Cases The data show a sample of...Ch. 3 - Tallest Buildings The number of stories in the 13...Ch. 3 - Rise in Tides Shown here is a frequency...Ch. 3 - Fuel Capacity The fuel capacity in gallons for...Ch. 3 - If the range of a data set is 24, find the...Ch. 3 - If the range of a data set is 56, find the...Ch. 3 - Textbooks in Professors Offices If the average...Ch. 3 - Magazines in Bookstores A survey of bookstores...Ch. 3 - Cost of Car Rentals A survey of car rental...Ch. 3 - AID: 1825 | 28/05/2018 16. Average Earnings of...Ch. 3 - Labor Charges The average labor charge for...Ch. 3 - Costs to Train Employees For a certain type of...Ch. 3 - Cost of a Mans Haircut The average cost of a mans...Ch. 3 - Exam Completion Time The mean time it takes a...Ch. 3 - Cases of Meningitis The data show the number of...Ch. 3 - Exam Grades Which of these exam grades has a...Ch. 3 - The number of police calls a small police...Ch. 3 - Printer Repairs The frequency distribution shows...Ch. 3 - Check each data set for outliers. a. 506, 511,...Ch. 3 - Check each data set for outliers. a. 14, 18, 27,...Ch. 3 - Named Storms The data show the number of named...Ch. 3 - Hours Worked The data shown here represent the...Ch. 3 - From the Data Bank, choose one of the following...Ch. 3 - Prob. 2DACh. 3 - Prob. 3DACh. 3 - Randomly select 10 values from the number of...Ch. 3 - Prob. 5DACh. 3 - AID: 1825 | 28/05/2018 Determine whether each...Ch. 3 - Prob. 2CQCh. 3 - Determine whether each statement is true or false....Ch. 3 - Prob. 4CQCh. 3 - In a data set, the mode will always be unique.Ch. 3 - Prob. 6CQCh. 3 - Determine whether each statement is true or false....Ch. 3 - Prob. 8CQCh. 3 - Determine whether each statement is true or false....Ch. 3 - Prob. 10CQCh. 3 - Prob. 11CQCh. 3 - Prob. 12CQCh. 3 - Which is not part of the five-number summary? a....Ch. 3 - A statistic that tells the number of standard...Ch. 3 - When a distribution is bell-shaped, approximately...Ch. 3 - Prob. 16CQCh. 3 - Generally, Greek letters are used to represent...Ch. 3 - Prob. 18CQCh. 3 - The symbol for the population standard deviation...Ch. 3 - When the sum of the lowest data value and the...Ch. 3 - If the mode is to the left of the median and the...Ch. 3 - An extremely high or extremely low data value is...Ch. 3 - Prob. 23CQCh. 3 - Prob. 24CQCh. 3 - Employee Years of Service In an advertisement, a...Ch. 3 - Newspapers for Sale The average number of...Ch. 3 - Prob. 27CQCh. 3 - Hours Worked The data shown here represent the...Ch. 3 - Prob. 29CQCh. 3 - Prob. 30CQCh. 3 - Exam Scores On a philosophy comprehensive exam,...Ch. 3 - Prob. 32CQCh. 3 - Prob. 1CTCCh. 3 - Ages of U.S. Residents The table shows the median...
Knowledge Booster
Background pattern image
Statistics
Learn more about
Need a deep-dive on the concept behind this application? Look no further. Learn more about this topic, statistics and related others by exploring similar questions and additional content below.
Recommended textbooks for you
Text book image
Glencoe Algebra 1, Student Edition, 9780079039897...
Algebra
ISBN:9780079039897
Author:Carter
Publisher:McGraw Hill
Text book image
Holt Mcdougal Larson Pre-algebra: Student Edition...
Algebra
ISBN:9780547587776
Author:HOLT MCDOUGAL
Publisher:HOLT MCDOUGAL
Text book image
Algebra & Trigonometry with Analytic Geometry
Algebra
ISBN:9781133382119
Author:Swokowski
Publisher:Cengage
How to make Frequency Distribution Table / Tally Marks and Frequency Distribution Table; Author: Reenu Math;https://www.youtube.com/watch?v=i_A6RiE8tLE;License: Standard YouTube License, CC-BY
Frequency distribution table in statistics; Author: Math and Science;https://www.youtube.com/watch?v=T7KYO76DoOE;License: Standard YouTube License, CC-BY
Frequency Distribution Table for Grouped/Continuous data | Math Dot Com; Author: Maths dotcom;https://www.youtube.com/watch?v=ErnccbXQOPY;License: Standard Youtube License