
Concept explainers
The sub-surface profile at a certain site is shown in Figure 3.20. Compute
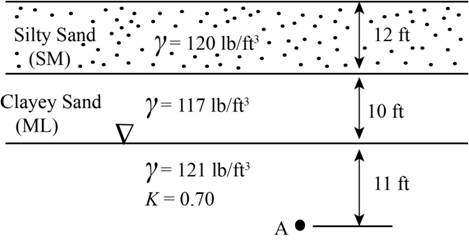
Figure 3.20
Soil profile for Problem 3.6.

Learn your wayIncludes step-by-step video

Chapter 3 Solutions
EBK FOUNDATION DESIGN
Additional Engineering Textbook Solutions
Elementary Surveying: An Introduction To Geomatics (15th Edition)
Materials for Civil and Construction Engineers (4th Edition)
Structural Analysis (10th Edition)
Elementary Surveying (14th Edition)
Modern Database Management (12th Edition)


- Q-C Refer to the soil profile shown in Fig. Q-c (page 2). Calculate and plot o, u and o' with depth.arrow_forwardThe soil sample in a tri axial test have the following stresses Cell pressure 25 Кра 34 Кра Pore stress Deviator stress 20 Кра 31 Кра 12 Кра 10 Кра a) Calculate the drained angle of internal friction b) Find the cohesion of soil c) What is the angle of failure in shear?arrow_forwardConsider the soil detail and profile are shown in the Table 1.1 and Figure 1.2. Table 1.1 Layer No. Thickness, H Soil Parameters e = 0.52, Gs = 2.62 e = 0.52, Gs = 2.65 w = 20%, e = 0.50 1 4.8 m 2 2.5 m 3 2.2 m Layer 1 H2 Layer 2 C. Layer 3 Figure 1.2 O Dry sand Sand D Clay Rock If groundwater table is x = 0.25 m above point B (use yw = 9.81 kN/m3), determine: a. The effective stress at point D. b. If the effective stress at point D is lowered by 10 kPa, what is the new elevation (new x) of groundwater table measured from point B?arrow_forward
- A soil profile is shown in Figure 6.24. Calculate the values of o, u, and o at points A, B, C, and D. Plot the variation of ơ, u, and ơ with depth. We are given the values in the table. Layer No. Thickness (m) Unit weight (kN/m³) H = 2 H2 = 3 = 7 I Ydry = 15 Ysat = 17.8 II %3D III %3D Ysat = 18.6arrow_forward22. A sample of moist soil has a water content of 26%, a void ratio of 1.1, and a Gs of 2.7 a. Draw the phase diagram and fill it in with numerical values b. Determine S, n, yd, Ysat, Ysubarrow_forward9.1 Through 9.3 A soil profile consisting of three layers is shown in Figure 9.25. Calculate the values of ơ, u, and o' at points A, B, C, and D for the following cases. In each case, plot the variations of ơ, u, and o' with depth. Characteristics of layers 1, 2, and 3 for each case are given below: H Layer I Groundwater table H2 Layer 2 Layer 3 | Dry sand Sand a Clay Rock Figure 9.25 Layer no. Thickness Soll parameters H; = 2.1 m Hz = 3.66 m - 1.83 m Ye = 17.23 kN/m 18.96 kN/m 18.5 kN/m 9.1 Yut 3 H3 Yautarrow_forward
- Q2. A soil profile consisting of three layers is shown in Figure 1 below. Unit weight of water (yw) = 9.81 kN/m³ Layer no. 1 2 3 ↑ H₁ H₂ Dry sand Sand Clay Rock Figure 1: Soil Profile Thickness H₁ = 1.5 m H₂ = 2.53 m H3 = 2.64 m Layer 1 Groundwater table Layer 2 Layer 3 Soil parameters Yd = 16.5 kN/m³, Ysat = 17.42 kN/m³ Ya = 16.5 kN/m³, Ysat = 18.55 kN/m³ Yd = 17.50 kN/m³, Ysat = 19.23 kN/m³ a) Calculate the values of o, u and o' at points A, B, C and D. b) Calculate the effective stress at C when water table drops by 2 m. c) Calculate the effective stress at C when water table rises by 1 m above layer 1 due to flooding.arrow_forward.In the given soil profile detemine the 6,µ and 6' of the points A,B.C and D. Show the variations in a diagram, Considering NO seepage. H1 = 4.0 m e = 0.4 H1 Layer 1 Gs = 2.65 Ground water H2 = 5.0 m e= 0.6 H2 Layer 2 Gs = 2.68 H3 = 3.0 m H3 Layer 3 e = 0.81, Gs = 2.73 %3Darrow_forward2) A soil profile consisting of three layers is shown in the Figure. A) Calculate the values of σ, u and σ' at points A,B,C and D if Layer 1: H1=5m, e=0.7, Gs=2.69 Layer 2: H2=8m, e=0.55, Gs=2.7 Layer 3: H3=3m, w=38%, e=1.2 B) What is the change in effective stress at point C if: If the water table drops by 2m? If the water table rises to the surface up to point A? Water level rises 3 m above point A due to flooding?arrow_forward
- A soil sample has a unit weight of 1.9 g/cc and w=12%. If Gs of solids is 2.65, determine the void ratio in percent. CHOICES: a.56.8 b.1.7 c.36 d.56arrow_forwardA soil profile is shown in Figure P3.3 along with the stan- dard penetration numbers in the clay layer. Use Eqs. (3.8b) and (3.9) to determine the variation of c, and OCR with depth. What is the average value of c, and OCR? Dry sand y = 16.5 kN/m² 1.5 m Groundwater table Sand 1.5 m Ysat = 19 kN/m³ N60 1.5 m • 8 Clay Ysat = 16.8 kN/m³ 1.5 m A • 8 1.5 m 9 1.5 m 10 Sandarrow_forwardExercise 1 A soil profile is shown in Figure Calculate the values of o, u, and o' at points A, B, C, and D. Plot the variation of o, u, and o' with depth. Dry sand roundwater table Thickness (ft) Unit weight (Ib/ft) Layer no. Laver IE H = 5 H2 = 6 H3 = 8 Ya = 112 Ysat = 120 Ysat = 125 Sand I II III TTE Figure 1arrow_forward
 Principles of Foundation Engineering (MindTap Cou...Civil EngineeringISBN:9781305081550Author:Braja M. DasPublisher:Cengage Learning
 Fundamentals of Geotechnical Engineering (MindTap...Civil EngineeringISBN:9781305635180Author:Braja M. Das, Nagaratnam SivakuganPublisher:Cengage Learning