
Subpart (a):
Demand and supply.
Subpart (a):
Answer to Problem 4P
Price shifts up and quantity shifts down – a.
Explanation of Solution
When the supply decreases with constant demand curve, it will lead to a decrease in the
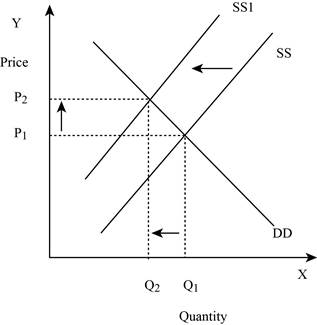
Figure -1
In Figure -1, the horizontal axis measures the quantity supplied and the vertical axis measures the price of the balls. ‘DD’ represents the demand and the demand curve shifts from DD to DD1; ‘SS’ represents the supply curve and the supply curve shifts from SS to SS1. Decrease in supply will lead to a decrease in the equilibrium quantity from ‘Q1 to Q2’ and an increase in the equilibrium price from ‘P1 to P2’.
Concept introduction:
Demand: Demand refers to the total value of the goods and services that are demanded at a particular price in the given period of time.
Supply: Supply refers to the total value of the goods and services that are available for purchase at a particular price in the given period of time.
Subpart (b):
Demand and supply.
Subpart (b):
Answer to Problem 4P
Price shifts down and quantity shifts down – b.
Explanation of Solution
When the demand decreases with constant supply curve, it will lead to a decrease in the equilibrium quantity and equilibrium price. This is shown below in Figure -2:
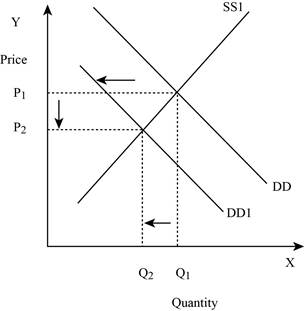
Figure -2
In Figure -2, the horizontal axis measures the quantity supplied and the vertical axis measures the price of the balls. ‘DD’ represents the demand and the demand curve shifts to the left from DD to DD1; ‘SS’ represents the supply curve. Decrease in supply will lead to a decrease in the equilibrium quantity from ‘Q1 to Q2’ and the equilibrium price from ‘P1 to P2’.
Concept introduction:
Demand: Demand refers to the total value of the goods and services that are demanded at a particular price in the given period of time.
Supply: Supply refers to the total value of the goods and services that are available for purchase at a particular price in the given period of time.
Subpart (c):
Demand and supply.
Subpart (c):
Answer to Problem 4P
Price shifts down and quantity shifts up – c.
Explanation of Solution
When the demand is constant with an increase in the supply curve, it will lead to a decrease in the equilibrium price and an increase in the equilibrium quantity. This is shown below in Figure -3:
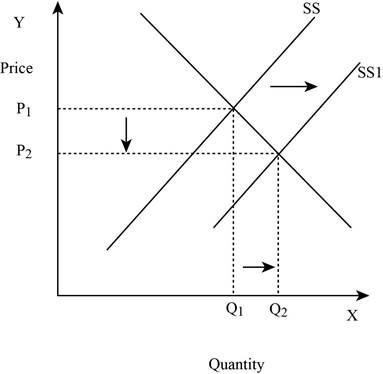
Figure -3
In Figure -3, the horizontal axis measures the quantity supplied and the vertical axis measures the price of the balls. ‘DD’ represents the demand and ‘SS’ represents the supply curve and the supply curve shifts to the right from SS to SS1. Increase in supply will lead to a decrease in the equilibrium price from ‘P1 to P2’ and an increase in the equilibrium quantity from ‘Q1 to Q2’.
Concept introduction:
Demand: Demand refers to the total value of the goods and services that are demanded at a particular price in the given period of time.
Supply: Supply refers to the total value of the goods and services that are available for purchase at a particular price in the given period of time.
Subpart (d):
Demand and supply.
Subpart (d):
Answer to Problem 4P
Price will indeterminate and quantity shifts up – d.
Explanation of Solution
When both the demand and supply increases, it will lead to an increase in the equilibrium quantity and the change in price is indeterminate. This is because an increase in the supply puts a downward pressure on the equilibrium price. This is shown below in Figure – 4:
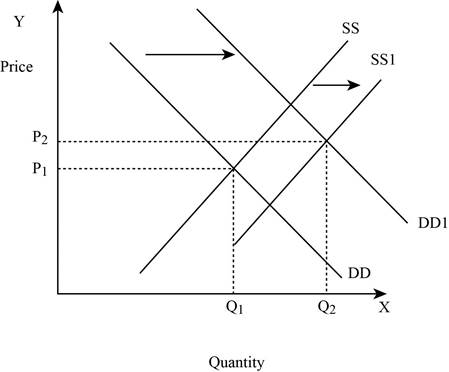
Figure -4
In Figure -4, the horizontal axis measures the quantity supplied and the vertical axis measures the price of the balls. ‘DD’ represents the demand curve and ‘SS’ represents the supply curve. Due to the increase in supply and demand, the supply curve shifts to the right from SS to SS1 and the demand curve shifts from DD to DD1. An increase in the supply leads to an increase in the equilibrium price from ‘P1 to P2’ and the equilibrium quantity from ‘Q1 to Q2’.
Concept introduction:
Demand: Demand refers to the total value of the goods and services that are demanded at a particular price in the given period of time.
Supply: Supply refers to the total value of the goods and services that are available for purchase at a particular price in the given period of time.
Subpart (e):
Demand and supply.
Subpart (e):
Answer to Problem 4P
Price shifts up and quantity shifts up – e.
Explanation of Solution
If the demand increases with constant supply, it leads to an increase in the equilibrium quantity and equilibrium price. This is shown below in Figure – 5:
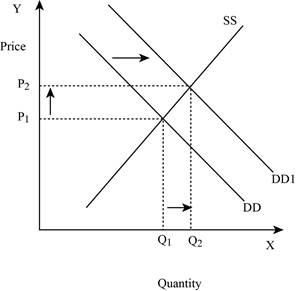
Figure -5
In Figure -5, the horizontal axis measures the quantity supplied and the vertical axis measures the price of the balls. ‘DD’ represents the demand curve and ‘SS’ represents the supply curve. Due to an increase in demand, the demand curve will shift the curve to the right from DD to DD1. An increase in demand will increase the equilibrium price from ‘P1 to P2’ and increases the equilibrium quantity from ‘Q1 to Q2’.
Concept introduction:
Demand: Demand refers to the total value of the goods and services that are demanded at a particular price in the given period of time.
Supply: Supply refers to the total value of the goods and services that are available for purchase at a particular price in the given period of time.
Subpart (f):
Demand and supply.
Subpart (f):
Answer to Problem 4P
Price shifts down and quantity indeterminate – f.
Explanation of Solution
If the supply increases with a decrease in demand, it leads to a decrease in the equilibrium price because both the curves put a pressure on the equilibrium price. Thus, an increase in supply increases the equilibrium quantity and a decrease in demand lead to a decrease in the equilibrium quantity. This is shown below in Figure – 6:
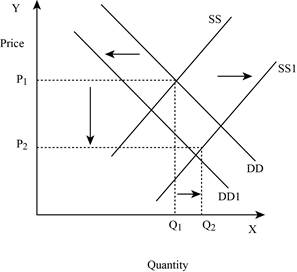
Figure -6
In Figure -6, the horizontal axis measures the quantity supplied and the vertical axis measures the price of the balls. ‘DD’ represents the demand curve and ‘SS’ represents the supply curve. Due to a decrease in demand and an increase in supply, demand curve will shift the curve to the left from DD to DD1. An increase in supply will lead to an increase in the equilibrium quantity from ‘P1 to P2’ and increases the equilibrium quantity from ‘Q1 to Q2’.
Concept introduction:
Demand: Demand refers to the total value of the goods and services that are demanded at a particular price in the given period of time.
Supply: Supply refers to the total value of the goods and services that are available for purchase at a particular price in the given period of time.
Subpart (g):
Demand and supply.
Subpart (g):
Answer to Problem 4P
Price shifts up and quantity indeterminate – g.
Explanation of Solution
If the supply decreases with an increase in demand, it will lead to an increase in the equilibrium price because both the curve put a pressure on the equilibrium price. An increase in demand will lead to an increase in the equilibrium quantity. This is shown below in Figure – 7:
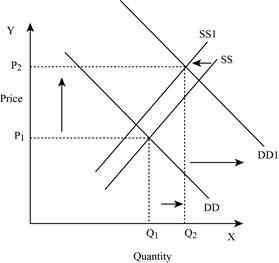
Figure -7
In Figure -7, the horizontal axis measures the quantity supplied and the vertical axis measures the price of the balls. ‘DD’ represents the demand and ‘SS’ represents the supply curve. Due to a decrease in supply and an increase in demand, the supply curve will shift the curve to the left from SS to SS1 and the demand curve shifts the curve to the right, which leads to an increase in the equilibrium price from ‘P1 to P2’ and the equilibrium quantity from ‘Q1 to Q2’.
Concept introduction:
Demand: Demand refers to the total value of the goods and services that are demanded at a particular price in the given period of time.
Supply: Supply refers to the total value of the goods and services that are available for purchase at a particular price in the given period of time.
Subpart (h):
Demand and supply.
Subpart (h):
Answer to Problem 4P
Price indeterminate and quantity shifts down – h.
Explanation of Solution
If both the supply and demand decreases, then it lead to a decrease in the equilibrium quantity and the change in equilibrium price is indeterminate. This is because a decrease in supply puts an upward pressure on the equilibrium price. This is shown below in Figure – 8:
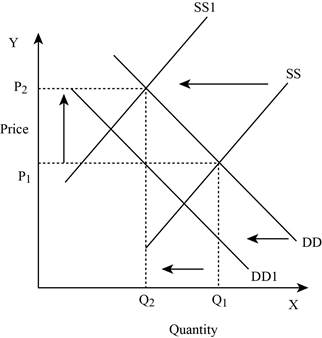
Figure -8
In Figure -8, the horizontal axis measures the quantity supplied and the vertical axis measures the price of the balls. ‘DD’ represents the demand and ‘SS’ represents the supply curve. Due to a decrease in supply and a decrease in demand, the supply curve will shift the curve to the left from SS to SS1 and the demand curve shifts the curve to the left, which lead to an increase in the equilibrium price from ‘P1 to P2’ and a decrease in the equilibrium quantity from ‘Q1 to Q2’.
Concept introduction:
Demand: Demand refers to the total value of the goods and services that are demanded at a particular price in the given period of time.
Supply: Supply refers to the total value of the goods and services that are available for purchase at a particular price in the given period of time.
Want to see more full solutions like this?
Chapter 3 Solutions
MICROECONOMICS W/CONNECT >IC<

- ADVANCED ANALYSIS Assume that demand for a commodity is represented by the equation P=80−2Qd.P=80−2Qd. Supply is represented by the equation P=−20+2Qs,P=−20+2Qs, where Qd and Qs are quantity demanded and quantity supplied, respectively, and P is price.Instructions: Round your answer for price to 2 decimal places and enter your answer for quantity as a whole number. Using the equilibrium condition Qs = Qd, solve the equations to determine equilibrium price and equilibrium quantity.arrow_forwardSuppose demand and supply are given by: (LO3, LO4)Qx d = 14 − 1/2 Px and Qx s = 1/4Px − 1a. Determine the equilibrium price and quantity. Show the equilibrium graphically.arrow_forward3. Suppose that annual demand in the U.S. market for ice cream cones can be expressed as QD = 800 + .2I - 100P, where QD is the number of cones demanded in millions of cones, I equals average monthly income in dollars, and P is price in dollars per cone. Supply can be expressed as QS = 200 + 150P (with the same units for quantity and price). A. Graph the demand and supply curves for ice cream cones, assuming that average monthly income is $2,000, and solve for the equilibrium price and quantity. B. Now assume that average monthly income drops to $750 and supply is unchanged. Draw the new demand curve on the same graph as used in (a) above and solve for the new equilibrium price and quantity. How would you describe the shift in demand intuitivelyarrow_forward
- Show the change graphically for a simultaneous decrease in demand and a increase in supply. For each scenario, state how equilibrium price and quantity changes. What is the conclusion of these changes (can you say for certainty what direction to equilibrium quantity and price changes)? Recall you have three sets of graphs here. Demand changes by a larger magnitude than Supply Demand changes by a smaller magnitude than Supply Demand and Supply changes by the same magnitude.arrow_forwardADVANCED ANALYSIS Assume that demand for a commodity is represented by the equation P=75−2Qd.P=75−2Qd.Supply is represented by the equation P=−15+4Qs,P=−15+4Qs,where Qd and Qs are quantity demanded and quantity supplied, respectively, and P is price.Instructions: Round your answer for price to 2 decimal places and enter your quantity as a whole number.a. Using the equilibrium condition Qs = Qd, determine equilibrium price. b. Now determine equilibrium quantity.arrow_forwardSuppose IronTown demand and supply curves for oil is given by ? = 500−4? ? = −100+6? Determine which one is the supply curve and which one is the demand curve and why? Calculate the equilibrium price and quantity. Suppose that IronTown demand changes to ? = 600−4?. Find the new equilibrium price and quantity. Compare what happens to equilibrium quantities and prices in questions (2) and (c)? From equation (1), if the current price is 110, describe what happens to quantities and prices of demand and supply in this market?arrow_forward
- Suppose that the price elasticity of demand for world famous Bi told that following a price increase, the quantity demanded fell b brought about this change in quantity demanded? O a. 40 percent O b. 25 percent O c. 2.5 percent O d. 0.4 percentarrow_forwardAssume that both the demand curve and the supply curve for coffee shift to the right but the demand curve shifts more than the supply curve. As a result O the equilibrium price of coffee will decrease; the equilibrium quantity may increase or decrease. O the equilibrium price of coffee may increase or decrease; the equilibrium quantity will increase. O both the equilibrium price and quantity of coffee will increase. O the equilibrium price of coffee will increase; the equilibrium quantity may increase or decrease.arrow_forward3. Individual and market demand Suppose that Jacques and Kyoko are the only consumers of pizza slices in a particular market. The following table shows their annual demand schedules: Price Jacques’s Quantity Demanded Kyoko’s Quantity Demanded (Dollars per slice) (Slices) (Slices) 1 40 80 2 25 60 3 15 40 4 5 30 5 0 20 On the following graph, plot Jacques’s demand for pizza slices using the green points (triangle symbol). Next, plot Kyoko’s demand for pizza slices using the purple points (diamond symbol). Finally, plot the market demand for pizza slices using the blue points (circle symbol). Note: Line segments will automatically connect the points. Remember to plot from left to right.arrow_forward
- please show work Suppose there is a decrease in the hourly wages of farm workers in Ontario who harvest blueberries. This Select one: O A. shifts the supply curve of blueberries rightward. B. shifts the demand curve for blueberries rightward . O C. shifts the demand curve for blueberries leftward. O D. shifts the supply curve of blueberries leftward. O E. decreases the quantity supplied of blueberries.arrow_forwardWhat will happen if the price were below the equilibrium price? Select one: O a. Quantity demanded would exceed quantity supplied and there would be a surplus O b. Quantity demanded would exceed quantity supplied and there would be a shortage O c. Quantity supplied would exceed quantity demanded and there would be a surplus O d. Quantity supplied would exceed quantity demanded and there would be a shortage Oe. Quantity supplied would equal quantity demanded and the market would cleararrow_forward5. Say’s Law _____________ because ___________. The Law of demand is _____ true because: Always holds true; As prices increase, new suppliers enter a market leading to an increase in supply and lower prices over time; almost always true; sometimes no matter what the price we will buy anyway. Always holds true; Entrepreneurs are the key to income creation and therefore the ultimate demand for all goods and services; always true; as prices change our willingness and/or ability to buy changes. Is often true; of the law of supply, which shows that as prices increase, quantity supplied will rise; is always true; demand curves can never be vertical. Is rarely true; it is consumer wants and needs the emerge in a market first, then suppliers enter to capitalize on what we want or need; valid; there is a proven inverse relationship between prices and quantity demanded. Is often, but not always true; Through the coordinated activities of government agencies, adequate supplies of food,…arrow_forward
 Principles of MicroeconomicsEconomicsISBN:9781305156050Author:N. Gregory MankiwPublisher:Cengage Learning
 Brief Principles of Macroeconomics (MindTap Cours...EconomicsISBN:9781337091985Author:N. Gregory MankiwPublisher:Cengage Learning