
Concept explainers
Videos
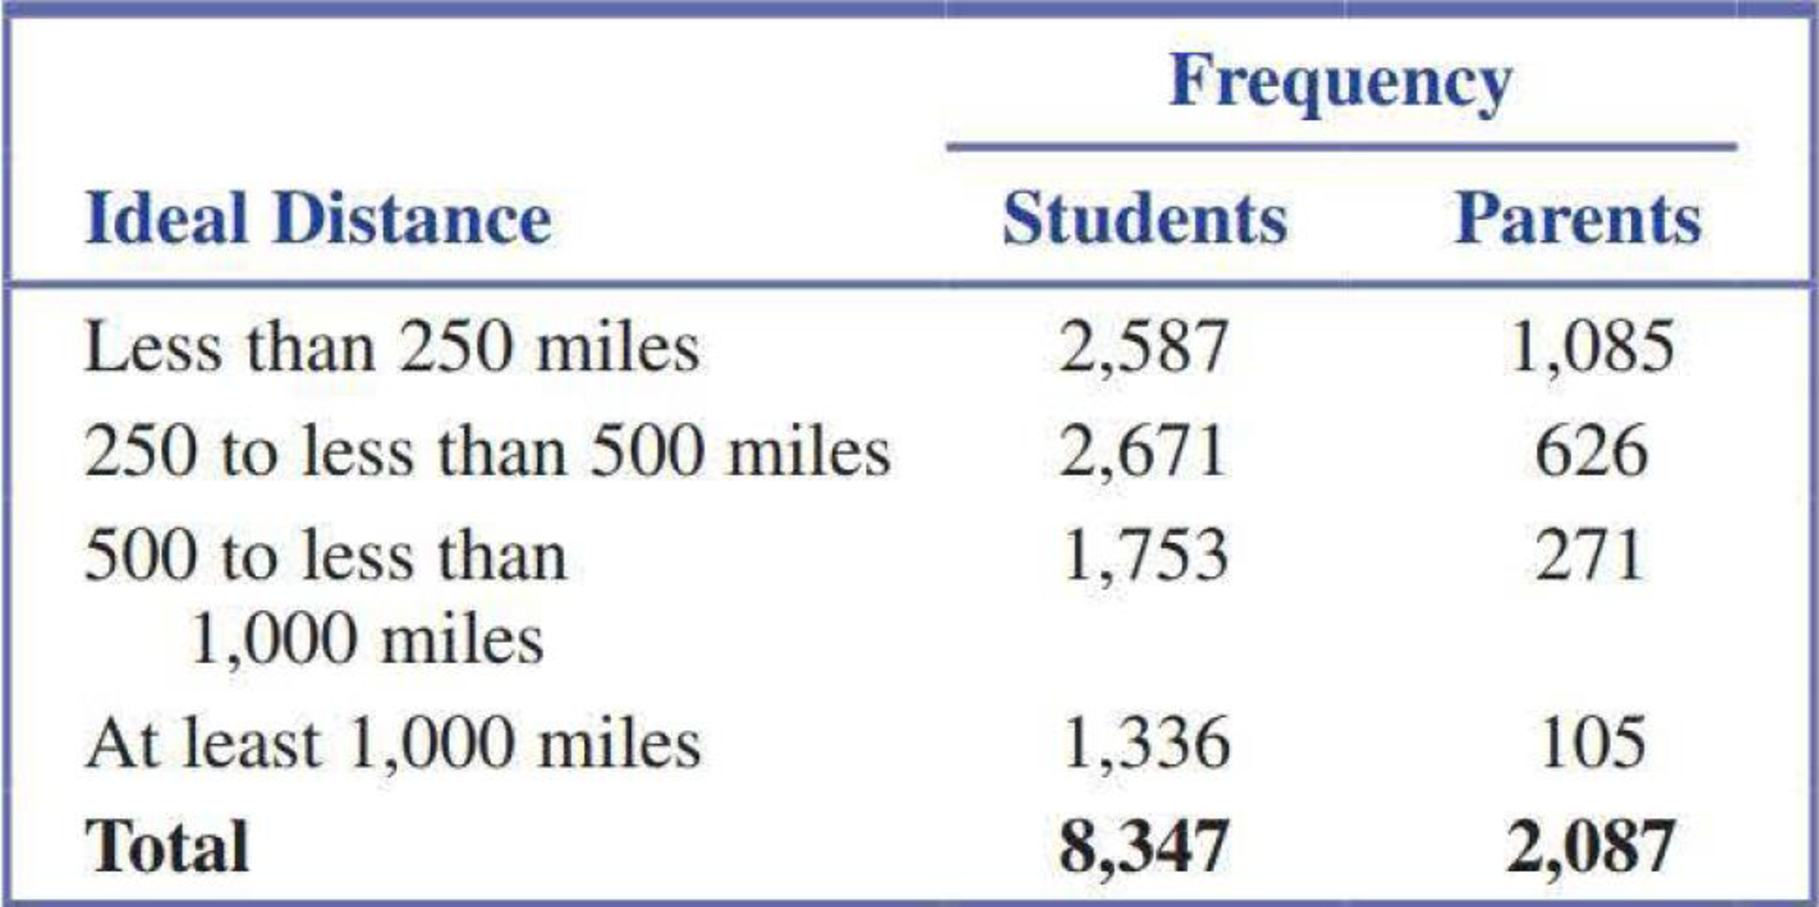
Each year, The Princeton Review conducts surveys of high school students who are applying to college and of parents of college applicants. The report “2016 College Hopes & Worries Survey Findings” (princetonreview.com/cms-content/final_cohowo2016survrpt.pdf, retrieved April 15, 2017) included a summary of how 8347 high school students responded to the question “Ideally how far from home would you like the college you attend to be?” Students responded by choosing one of four possible distance categories. Also included was a summary of how 2087 parents of students applying to college responded to the question “How far from home would you like the college your child attends to be?” The accompanying relative frequency table summarizes the student and parent responses.
- a. Explain why relative frequencies should be used when constructing a comparative bar chart to compare ideal distance for students and parents.
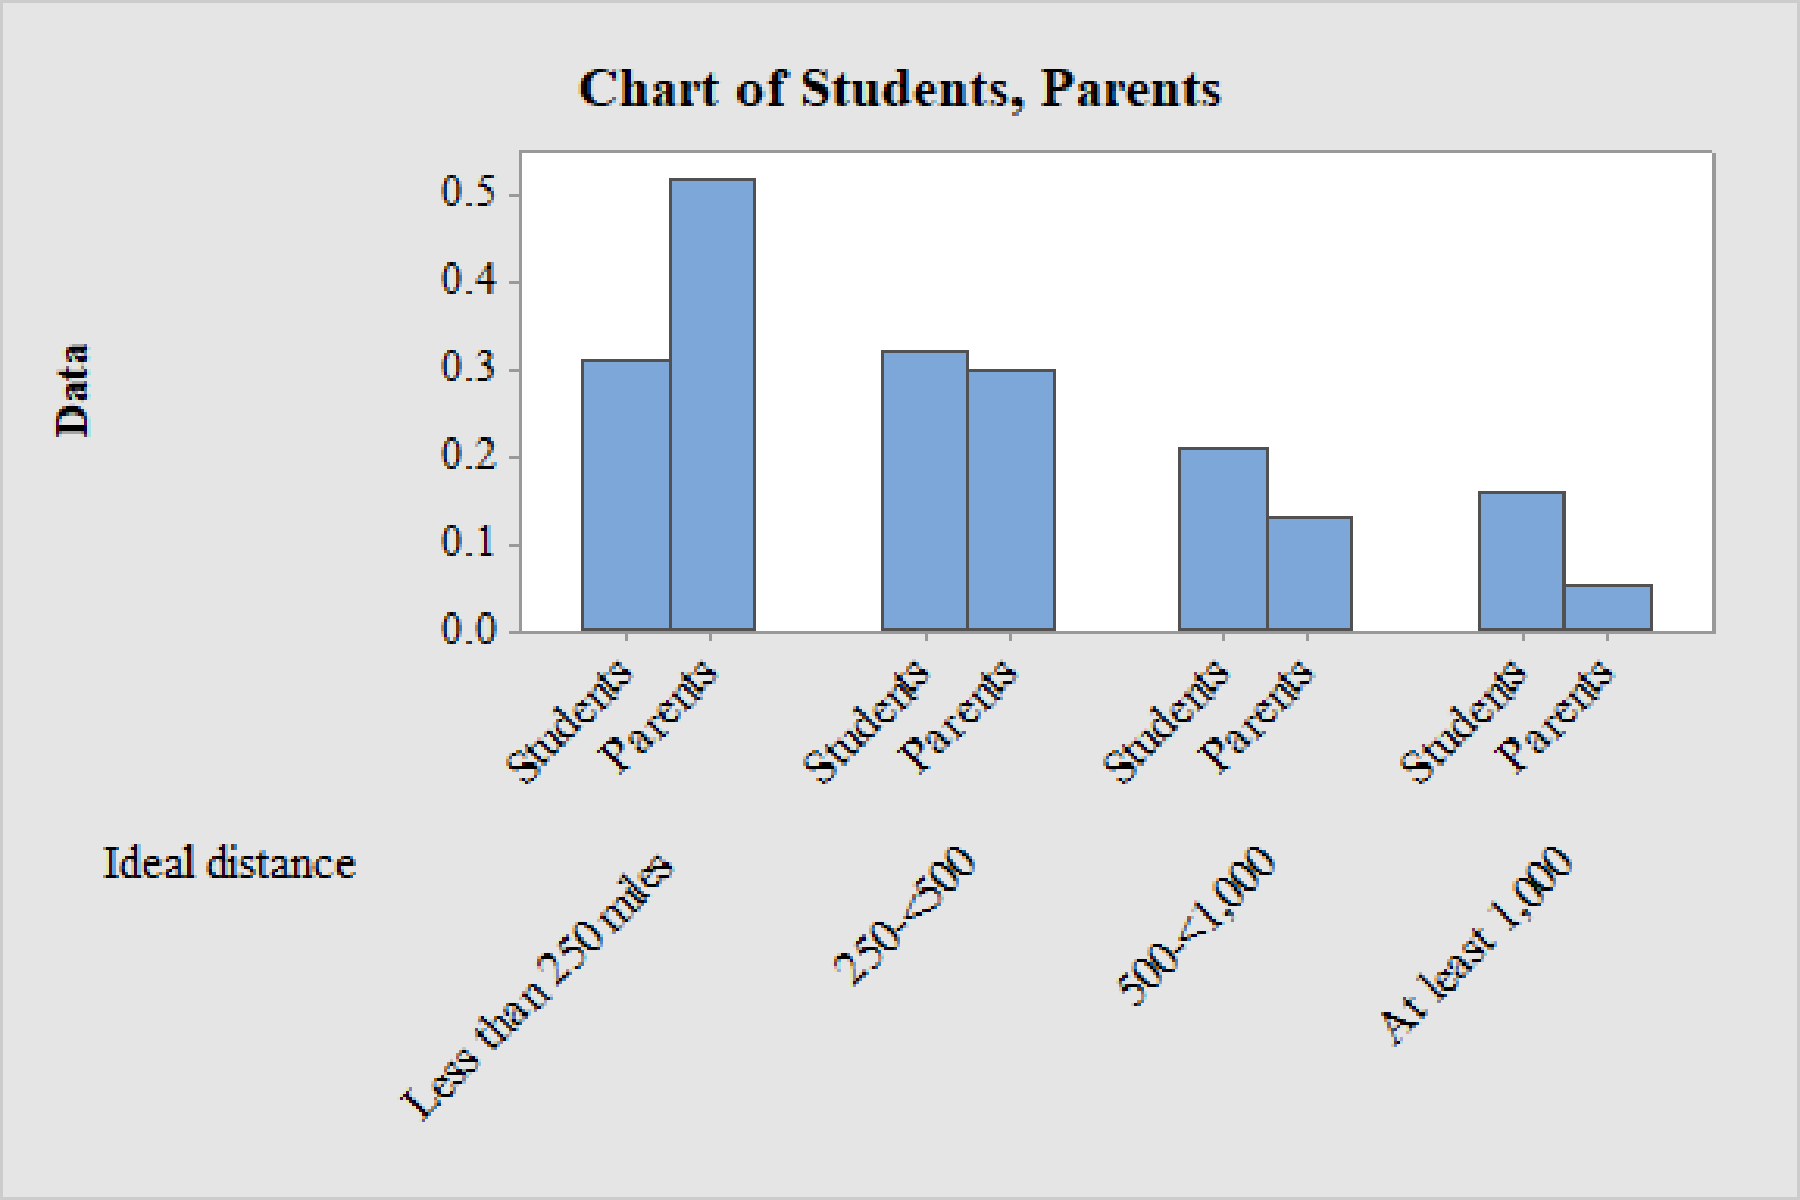
- b. Construct a comparative bar chart for these data.
- c. Write a few sentences commenting on similarities and differences in the distributions of ideal distance for parents and students.
a.
Explain the reason behind using the relative frequencies for constructing comparative bar-chart for ideal distances of students and parents.
Explanation of Solution
The data represent the frequency distribution of ideal distances for students and parents.
The total number of students is 8,347 and total number of parents is 2,087.
Here, the sizes of students and parents are not equal.
Therefore, the relative frequencies of ideal distances of parents and relative frequencies of ideal distances of students is used to construct the comparative bar chart.
b.
Construct the comparative bar-chart for the given data.
Answer to Problem 54CR
Output using MINITAB is given below.
Explanation of Solution
Calculation:
The general formula for the relative frequency is,
Relative frequencies for students:
Substitute the frequency of less than 250 miles “2,587” as the frequency and the total frequency as “8,347” in relative frequency.
Similarly, relative frequencies for the remaining ideal distances are obtained below:
| Ideal distance | Frequency(Students) | Relative frequency |
| Less than 250 miles | 2,587 | |
| 250-<500 | 2,671 | |
| 500-<1,000 | 1,753 | |
| At least 1,000 miles | 1,336 |
Relative frequencies for parents:
Substitute the frequency of less than 250 miles “2,587” as the frequency and the total frequency as “8,347” in relative frequency.
Similarly, relative frequencies for the remaining ideal distances are obtained below:
| Ideal distance | Frequency(Parents) | Relative frequency |
| Less than 250 miles | 1,085 | |
| 250-<500 | 626 | |
| 500-<1,000 | 271 | |
| At least 1,000 miles | 105 |
Software procedure:
Step by step procedure to draw comparative bar chart by using MINITAB software as follows:
- Choose Graph > Bar Chart
- From Bars represent, choose Values from a table.
- Under Two-way table, choose Cluster.
- Click OK.
- In Graph variables, enter the column of Students and parents.
- In Row labels, enter the column of Ideal distance.
- In Table Arrangement, choose Rows are outermost categories and Columns are innermost.
- Click OK.
c.
Describe the similarities and differences between the distributions of ideal distance for parents and students.
Explanation of Solution
The following similarities and differences between the distributions of ideal distance for parents and students:
- Most of the parents want their children to be in less than 250 miles away from their homes.
- Most of the students want to be in 250 to less than 500 miles away from homes.
- In the category of more than 1,000 miles, the relative frequency is higher for students.
- On a whole it can be said that, students wants to be farther away from the home when compared with parents.
Want to see more full solutions like this?
Chapter 3 Solutions
Introduction To Statistics And Data Analysis
Additional Math Textbook Solutions
Elementary Statistics: Picturing the World (7th Edition)
Elementary Statistics: A Step By Step Approach
Essentials of Statistics (6th Edition)
Statistical Reasoning for Everyday Life (5th Edition)
Statistical Techniques in Business and Economics


 Glencoe Algebra 1, Student Edition, 9780079039897...AlgebraISBN:9780079039897Author:CarterPublisher:McGraw Hill
 Holt Mcdougal Larson Pre-algebra: Student Edition...AlgebraISBN:9780547587776Author:HOLT MCDOUGALPublisher:HOLT MCDOUGAL
 Big Ideas Math A Bridge To Success Algebra 1: Stu...AlgebraISBN:9781680331141Author:HOUGHTON MIFFLIN HARCOURTPublisher:Houghton Mifflin Harcourt