
Concept explainers
Videos
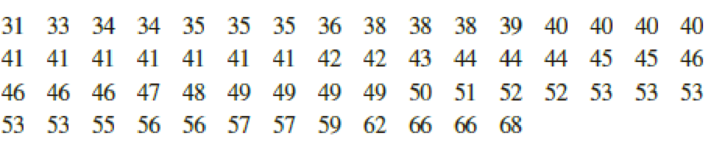
Political Science: Georgia Democrats How Democratic is Georgia? County-by-county results are shown for a recent election. For your convenience, the data have been sorted in increasing order (Source: County and City Data Book, 12th edition, U.S. Census Bureau).
Percentage of Democratic vote by counties in Georgia
- (a) Make a box-and-whisker plot of the data. Find the
interquartile range . - (b) Grouped Data Make a frequency table using five classes. Then estimate the
mean and sample standard deviation using the frequency table. Compute a 75% Chebyshev interval centered about the mean. - (c) If you have a statistical calculator or computer, use it to find the actual sample mean and sample standard deviation. Otherwise, use the values Σx – 2769 and Σx2 – 132,179 to compute the sample mean and sample standard deviation.
a.
Draw the box-and-whisker plot.
Find the interquartile range.
Answer to Problem 5CRP
The box-and-whisker plot is shown below:
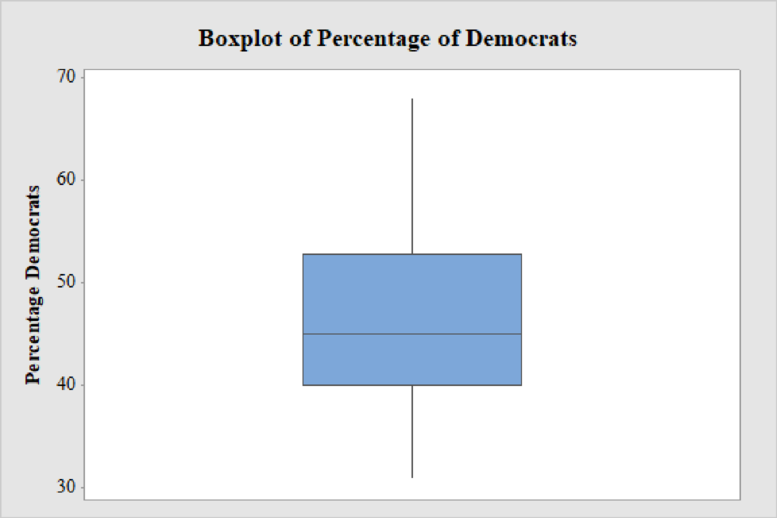
The interquartile range is 12.75.
Explanation of Solution
Step-by-step procedure to draw the box-and-whisker plot using MINITAB software:
- Choose Graph > Boxplot or Stat > EDA > Boxplot.
- Under One Y, choose Simple. Click OK.
- In Graph variables, enter the data of Democrats.
- Click OK in all dialogue boxes.
Step-by-step procedure to obtain the interquartile range using MINITAB software:
- Choose Stat > Basic Statistics > Display Descriptive Statistics.
- In Variables, enter the columns Percentage_Democrats.
- Check Options, Select Interquartile range.
- Click OK in all dialogue boxes.
Output obtained using the MINITAB software is given below:
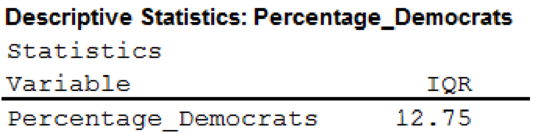
From the output, the interquartile range is 12.75.
b.
Create a table for frequency table with five.
Find the mean and sample standard deviation using the frequency table.
Find the 75% Chebyshev interval centered about the mean.
Answer to Problem 5CRP
The frequency distribution table is given below:
| Class Limits | Midpoints | Frequency |
| 31-38 | 34.5 | 11 |
| 39-46 | 42.5 | 24 |
| 47-54 | 50.5 | 15 |
| 55-62 | 58.5 | 7 |
| 63-70 | 66.5 | 3 |
The value of the sample mean is 46.1.
The sample standard deviation is 8.64.
The 75% Chebyshev interval centered about the mean are between 28.82 and 63.38.
Explanation of Solution
Midpoint:
The midpoint is calculated as given below:
Frequency:
Frequency is the number of data points that fall under each class.
From the given data set, the largest data point is 200 and the smallest data point is 10.
Class Width:
The class width is calculated as follows:
The class width is 8. Hence, the lower class limit for the second class 39 is calculated by adding 8 to 31. Following this pattern, all the lower class limits are established. Then, the upper class limits are calculated.
The frequency distribution table is given below:
| Class Limits | Midpoints | Frequency |
| 31-38 | 34.5 | 11 |
| 39-46 | 42.5 | 24 |
| 47-54 | 50.5 | 15 |
| 55-62 | 58.5 | 7 |
| 63-70 | 66.5 | 3 |
The formula for the sample mean, the sample variance, and the sample standard deviation for grouped data is given below:
Where, x is the midpoint,
The midpoint and the frequency is obtained from the histogram.
The value of
| Midpoint (x) | Frequency (f) | xf |
| 34.5 | 11 | 379.5 |
| 42.5 | 24 | 1020 |
| 50.5 | 15 | 757.5 |
| 58.5 | 7 | 409.5 |
| 66.5 | 3 | 199.5 |
The value of sample mean is obtained below:
Thus, the value of the sample mean is 46.1.
The value of
| Midpoint (x) | Frequency (f) | |||
| 34.5 | 11 | –11.6 | 134.56 | 1,480.16 |
| 42.5 | 24 | –3.6 | 12.96 | 311.04 |
| 50.5 | 15 | 4.4 | 19.36 | 290.4 |
| 58.5 | 7 | 12.4 | 153.76 | 1,076.32 |
| 66.5 | 3 | 20.4 | 416.16 | 1,248.48 |
The sample standard deviation is obtained below:
Thus, the sample standard deviation is 8.64.
The 75% Chebyshev interval centered on the mean is obtained below:
Thus, the 75% Chebyshev interval centered about the mean are between 28.82 and 63.38.
c.
Find the actual sample mean and sample standard deviation using statistical computer.
Answer to Problem 5CRP
The value of actual sample mean is 46.15.
The value of sample standard deviation is 8.63.
Explanation of Solution
Step-by-step procedure to obtain the mean and standard deviation using MINITAB software:
- Choose Stat > Basic Statistics > Display Descriptive Statistics.
- In Variables enter the columns Percentage_Democrats.
- Check Options, Select Mean, and standard deviation.
- Click OK in all dialogue boxes.
Output obtained using the MINITAB software is given below:
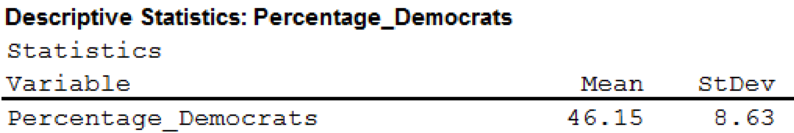
From the MINITAB output, the value of actual sample mean is 46.15 and the value of sample standard deviation is 8.63.
Want to see more full solutions like this?
Chapter 3 Solutions
Bundle: Understandable Statistics: Concepts And Methods, 12th + Webassign, Single-term Printed Access Card


 Big Ideas Math A Bridge To Success Algebra 1: Stu...AlgebraISBN:9781680331141Author:HOUGHTON MIFFLIN HARCOURTPublisher:Houghton Mifflin Harcourt
 Glencoe Algebra 1, Student Edition, 9780079039897...AlgebraISBN:9780079039897Author:CarterPublisher:McGraw Hill
 Holt Mcdougal Larson Pre-algebra: Student Edition...AlgebraISBN:9780547587776Author:HOLT MCDOUGALPublisher:HOLT MCDOUGAL