Essentials of Statistics for Business and Economics, Loose-leaf Version
8th Edition
ISBN: 9781337114196
Author: David R. Anderson, Dennis J. Sweeney, Thomas A. Williams, Jeffrey D. Camm, James J. Cochran
Publisher: South-Western College Pub
bartleby

Concept explainers

bartleby

Videos

Question
Book Icon
Chapter 3, Problem 62SE

a.

To determine

Find the mean and median.

a.

Expert Solution
Check Mark

Answer to Problem 62SE

The mean and median are 2.95 and 3, respectively.

Explanation of Solution

Calculation:

The data represent the number of times a sample of 20 families dined out in the previous week.

Store the variable, “Number of times the families dined outside in the previous week” in Column C11 of a MINITAB worksheet.

Mean and Median:

Software Procedure:

Step-by-step procedure to obtain the mean and median using MINITAB software:

  • Choose Stat > Basic Statistics > Display Descriptive Statistics.
  • In Variables enter the columns C11.
  • In Statistics select Mean and Median.
  • Click OK.

The output obtained using MINITAB software is given below:

Essentials of Statistics for Business and Economics, Loose-leaf Version, Chapter 3, Problem 62SE , additional homework tip  1

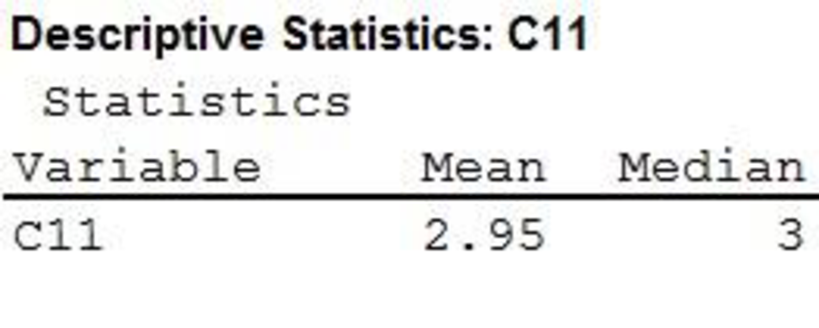
Thus, mean and median are 2.95 and 3, respectively.

b.

To determine

Find the first quartile and third quartile.

b.

Expert Solution
Check Mark

Answer to Problem 62SE

The first quartile is 1 and the third quartile is 4.75.

Explanation of Solution

Calculation:

First quartile and Third quartile:

Software Procedure:

Step-by-step procedure to obtain the first and third quartiles using MINITAB software:

  • Choose Stat > Basic Statistics > Display Descriptive Statistics.
  • In Variables enter the columns C11.
  • In Statistics select First quartile and Third quartile.
  • Click OK.

The output obtained using MINITAB software is given below:

Essentials of Statistics for Business and Economics, Loose-leaf Version, Chapter 3, Problem 62SE , additional homework tip  2

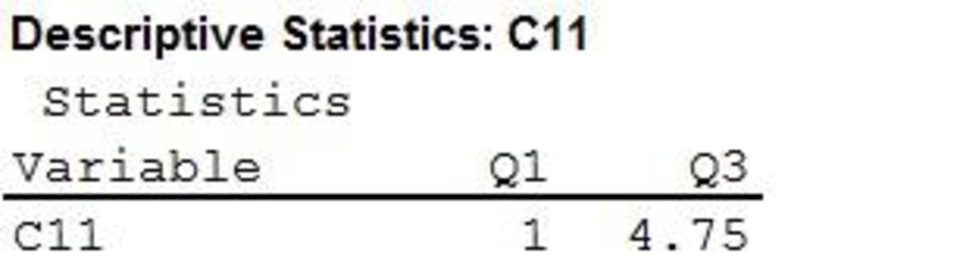
Thus, the first and third quartiles are 1 and 4.75, respectively.

c.

To determine

Find the range and interquartile range.

c.

Expert Solution
Check Mark

Answer to Problem 62SE

The range and interquartile range are 7 and 3.75, respectively.

Explanation of Solution

Calculation:

Range, and Interquartile range:

Software Procedure:

Step-by-step procedure to obtain the range and interquartile range using the MINITAB software:

  • Choose Stat > Basic Statistics >Display Descriptive Statistics.
  • Click OK.
  • In Variables, enter the column of C11.
  • In Statistics select Range and Interquartile range.
  • Click OK.

The output obtained using MINITAB software is given below:

Essentials of Statistics for Business and Economics, Loose-leaf Version, Chapter 3, Problem 62SE , additional homework tip  3

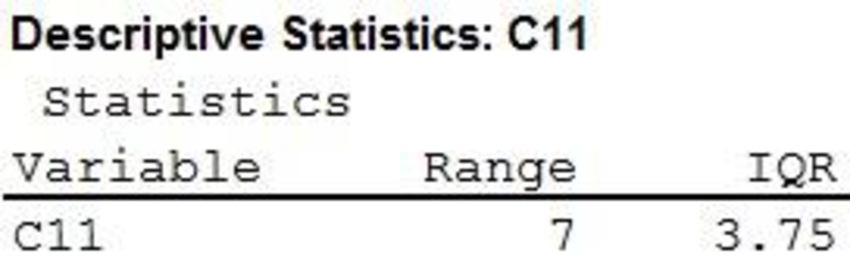
Thus, the range of the data is 7 and the interquartile range is 3.75.

d.

To determine

Find the variance and standard deviation.

d.

Expert Solution
Check Mark

Answer to Problem 62SE

The variance and standard deviation are 4.366 and 2.089, respectively.

Explanation of Solution

Calculation:

Software Procedure:

Step-by-step procedure to obtain the variance and standard deviation using MINITAB software:

  • Choose Stat > Basic Statistics >Display Descriptive Statistics.
  • Click OK.
  • In Variables, enter the column of C11.
  • In Statistics select Variance and Standard deviation.
  • Click OK.

The output obtained using MINITAB software is given below:

Essentials of Statistics for Business and Economics, Loose-leaf Version, Chapter 3, Problem 62SE , additional homework tip  4

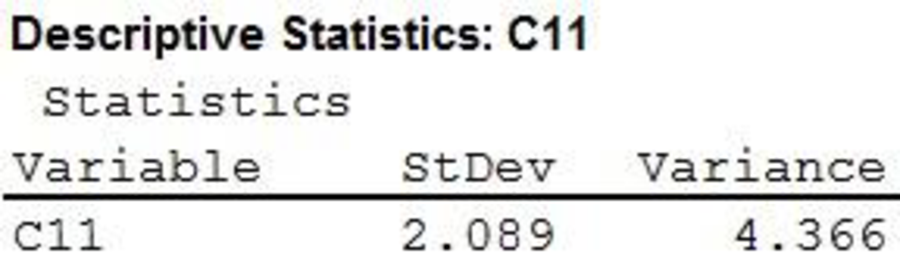
Thus, the variance of the data is 4.366 and the standard deviation is 2.089.

e.

To determine

Explain about the shape of the distribution and also explain the reason for the expected shape.

e.

Expert Solution
Check Mark

Explanation of Solution

The given information is that the skewness measure for the data is 0.34.

Skewness:

  • If the value of skewness is equal to zero, then the distribution is symmetric.
  • If the skewness value is less than zero, then the distribution is negatively skewed.
  • If the skewness value is greater than zero, then the distribution is positively skewed.

Here, the skewness is 0.34, which is greater than zero. Hence, the shape of the distribution is positively skewed.

f.

To determine

Check whether the data contain any outliers.

f.

Expert Solution
Check Mark

Answer to Problem 62SE

The data has no outliers.

Explanation of Solution

Calculation:

The formula for the lower limit to detect outliers is as follows:

Lower limit=Q11.5IQR,

where Q1 is the first quartile and IQR is the interquartile range.

Substitute IQR=3.75 and Q1=1.

Lower limit=11.5(3.75)=15.625=4.625

Thus, the lower limit is –4.625.

The formula for the upper limit to detect outliers is as follows:

Upper limit=Q3+1.5IQR,

where Q3 is the third quartile and IQR is the interquartile range.

Substitute IQR=3.75 and Q3=4.75.

Upper limit=4.75+1.5(3.75)=4.75+5.625=10.375

Thus, the upper limit is 10.375.

Outlier:

The observation that falls outside of the overall pattern of the data is called an outlier.

The data values less than –4.625 or greater than 10.375 are considered as the outliers.

Here, all data values lie within the limits. Thus, the data have no outliers.

Want to see more full solutions like this?

Subscribe now to access step-by-step solutions to millions of textbook problems written by subject matter experts!

Chapter 3 Solutions

Essentials of Statistics for Business and Economics, Loose-leaf Version

Ch. 3.1 - According to the National Education Association...Ch. 3.1 - The Big Bang Theory, a situation comedy featuring...Ch. 3.1 - Automobile Fuel Efficiencies. In automobile...Ch. 3.1 - The data contained in the file named StateUnemp...Ch. 3.1 - Motor Oil Prices. Martinez Auto Supplies has...Ch. 3.1 - Calculating Grade Point Averages. The grade point...Ch. 3.1 - The following table shows the total return and the...Ch. 3.1 - Business School Ranking. Based on a survey of...Ch. 3.1 - Annual revenue for Corning Supplies grew by 5.5%...Ch. 3.1 - Prob. 20ECh. 3.1 - If an asset declines in value from $5000 to $3500...Ch. 3.1 - The current value of a company is 25 million. If...Ch. 3.2 - Consider a sample with data values of 10, 20, 12,...Ch. 3.2 - Consider a sample with data values of 10, 20, 12,...Ch. 3.2 - Consider a sample with data values of 27, 25, 20,...Ch. 3.2 - Price of Unleaded Gasoline. Data collected by the...Ch. 3.2 - The results of a search to find the least...Ch. 3.2 - The Australian Open is the first of the four Grand...Ch. 3.2 - Air Quality Index. The Los Angeles Times regularly...Ch. 3.2 - Prob. 30ECh. 3.2 - The results of Accounting Principals’ latest...Ch. 3.2 - Advertising Spend by Companies. Advertising Age...Ch. 3.2 - Scores turned in by an amateur golfer at the...Ch. 3.2 - Consistency of Running Times. The following times...Ch. 3.3 - Consider a sample with data values of 10, 20, 12,...Ch. 3.3 - Prob. 36ECh. 3.3 - Consider a sample with a mean of 30 and a standard...Ch. 3.3 - Suppose the data have a bell-shaped distribution...Ch. 3.3 - The results of a national survey showed that on...Ch. 3.3 - The Energy Information Administration reported...Ch. 3.3 - GMAT Exam Scores. The Graduate Management...Ch. 3.3 - Many families in California are using backyard...Ch. 3.3 - Prob. 43ECh. 3.3 - NCAA Basketball Game Scores. A sample of 10 NCAA...Ch. 3.3 - Prob. 45ECh. 3.4 - Consider a sample with data values of 27, 25, 20,...Ch. 3.4 - Show the boxplot for the data in exercise 46. 46....Ch. 3.4 - Prob. 48ECh. 3.4 - Prob. 49ECh. 3.4 - Naples Half-Marathon Times. Naples, Florida, hosts...Ch. 3.4 - Annual sales, in millions of dollars, for 21...Ch. 3.4 - Cell Phone Companies Customer Satisfaction....Ch. 3.4 - Most Admired Companies. Fortune magazines list of...Ch. 3.4 - U.S. Border Crossings. The Bureau of...Ch. 3.5 - Five observations taken for two variables follow....Ch. 3.5 - Five observations taken for two variables follow....Ch. 3.5 - Ten major college football bowl games were played...Ch. 3.5 - Driving Speed and Fuel Efficiency. A department of...Ch. 3.5 - Smoke Detector Use and Death Rates. Over the past...Ch. 3.5 - Stock Market Indexes Comparison. The Russell 1000...Ch. 3.5 - Best Private Colleges. A random sample of 30...Ch. 3 - Prob. 62SECh. 3 - USA Today reports that NCAA colleges and...Ch. 3 - Physician Office Waiting Times. The average...Ch. 3 - Worker Productivity and Insomnia. U.S. companies...Ch. 3 - A study of smartphone users shows that 68% of...Ch. 3 - Prob. 67SECh. 3 - Prob. 68SECh. 3 - Prob. 69SECh. 3 - Best Hotels. Travel + Leisure magazine provides an...Ch. 3 - Prob. 71SECh. 3 - MLB Team Winning Percentages. Does a major league...Ch. 3 - Money Market Funds Days to Maturity. The days to...Ch. 3 - Automobile Speeds. Automobiles traveling on a road...Ch. 3 - Annual Returns for Panama Railroad Company Stock....Ch. 3 - Pelican Stores, a division of National Clothing,...Ch. 3 - The motion picture industry is a competitive...Ch. 3 - The pursuit of a higher education degree in...Ch. 3 - Although millions of elephants once roamed across...
Knowledge Booster
Background pattern image
Statistics
Learn more about
Need a deep-dive on the concept behind this application? Look no further. Learn more about this topic, statistics and related others by exploring similar questions and additional content below.
Recommended textbooks for you
Text book image
Glencoe Algebra 1, Student Edition, 9780079039897...
Algebra
ISBN:9780079039897
Author:Carter
Publisher:McGraw Hill
The Shape of Data: Distributions: Crash Course Statistics #7; Author: CrashCourse;https://www.youtube.com/watch?v=bPFNxD3Yg6U;License: Standard YouTube License, CC-BY
Shape, Center, and Spread - Module 20.2 (Part 1); Author: Mrmathblog;https://www.youtube.com/watch?v=COaid7O_Gag;License: Standard YouTube License, CC-BY
Shape, Center and Spread; Author: Emily Murdock;https://www.youtube.com/watch?v=_YyW0DSCzpM;License: Standard Youtube License