INTRO.TO STATS.+DATA ANALYS. W/WEBASSI
5th Edition
ISBN: 9781337373692
Author: PECK
Publisher: CENGAGE L
bartleby

Concept explainers

bartleby

Videos

Textbook Question
Book Icon
Chapter 3, Problem 70CR

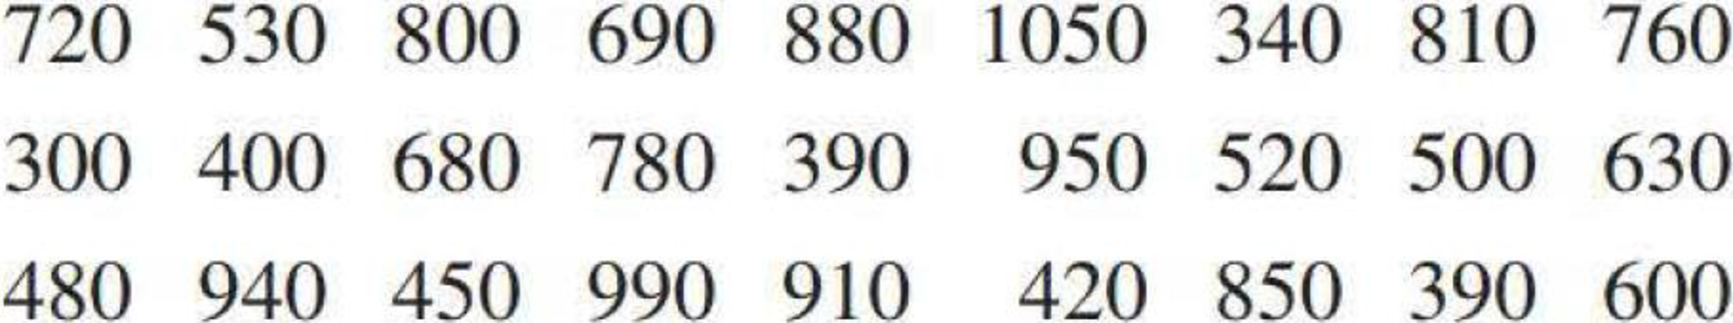
Many nutritional experts have expressed concern about the high levels of sodium in prepared foods. The following data on sodium content (in milligrams) per frozen meal appeared in the article “Comparison of ‘Light’ Frozen Meals” (Boston Globe, April 24, 1991):

Chapter 3, Problem 70CR, Many nutritional experts have expressed concern about the high levels of sodium in prepared foods. , example  1

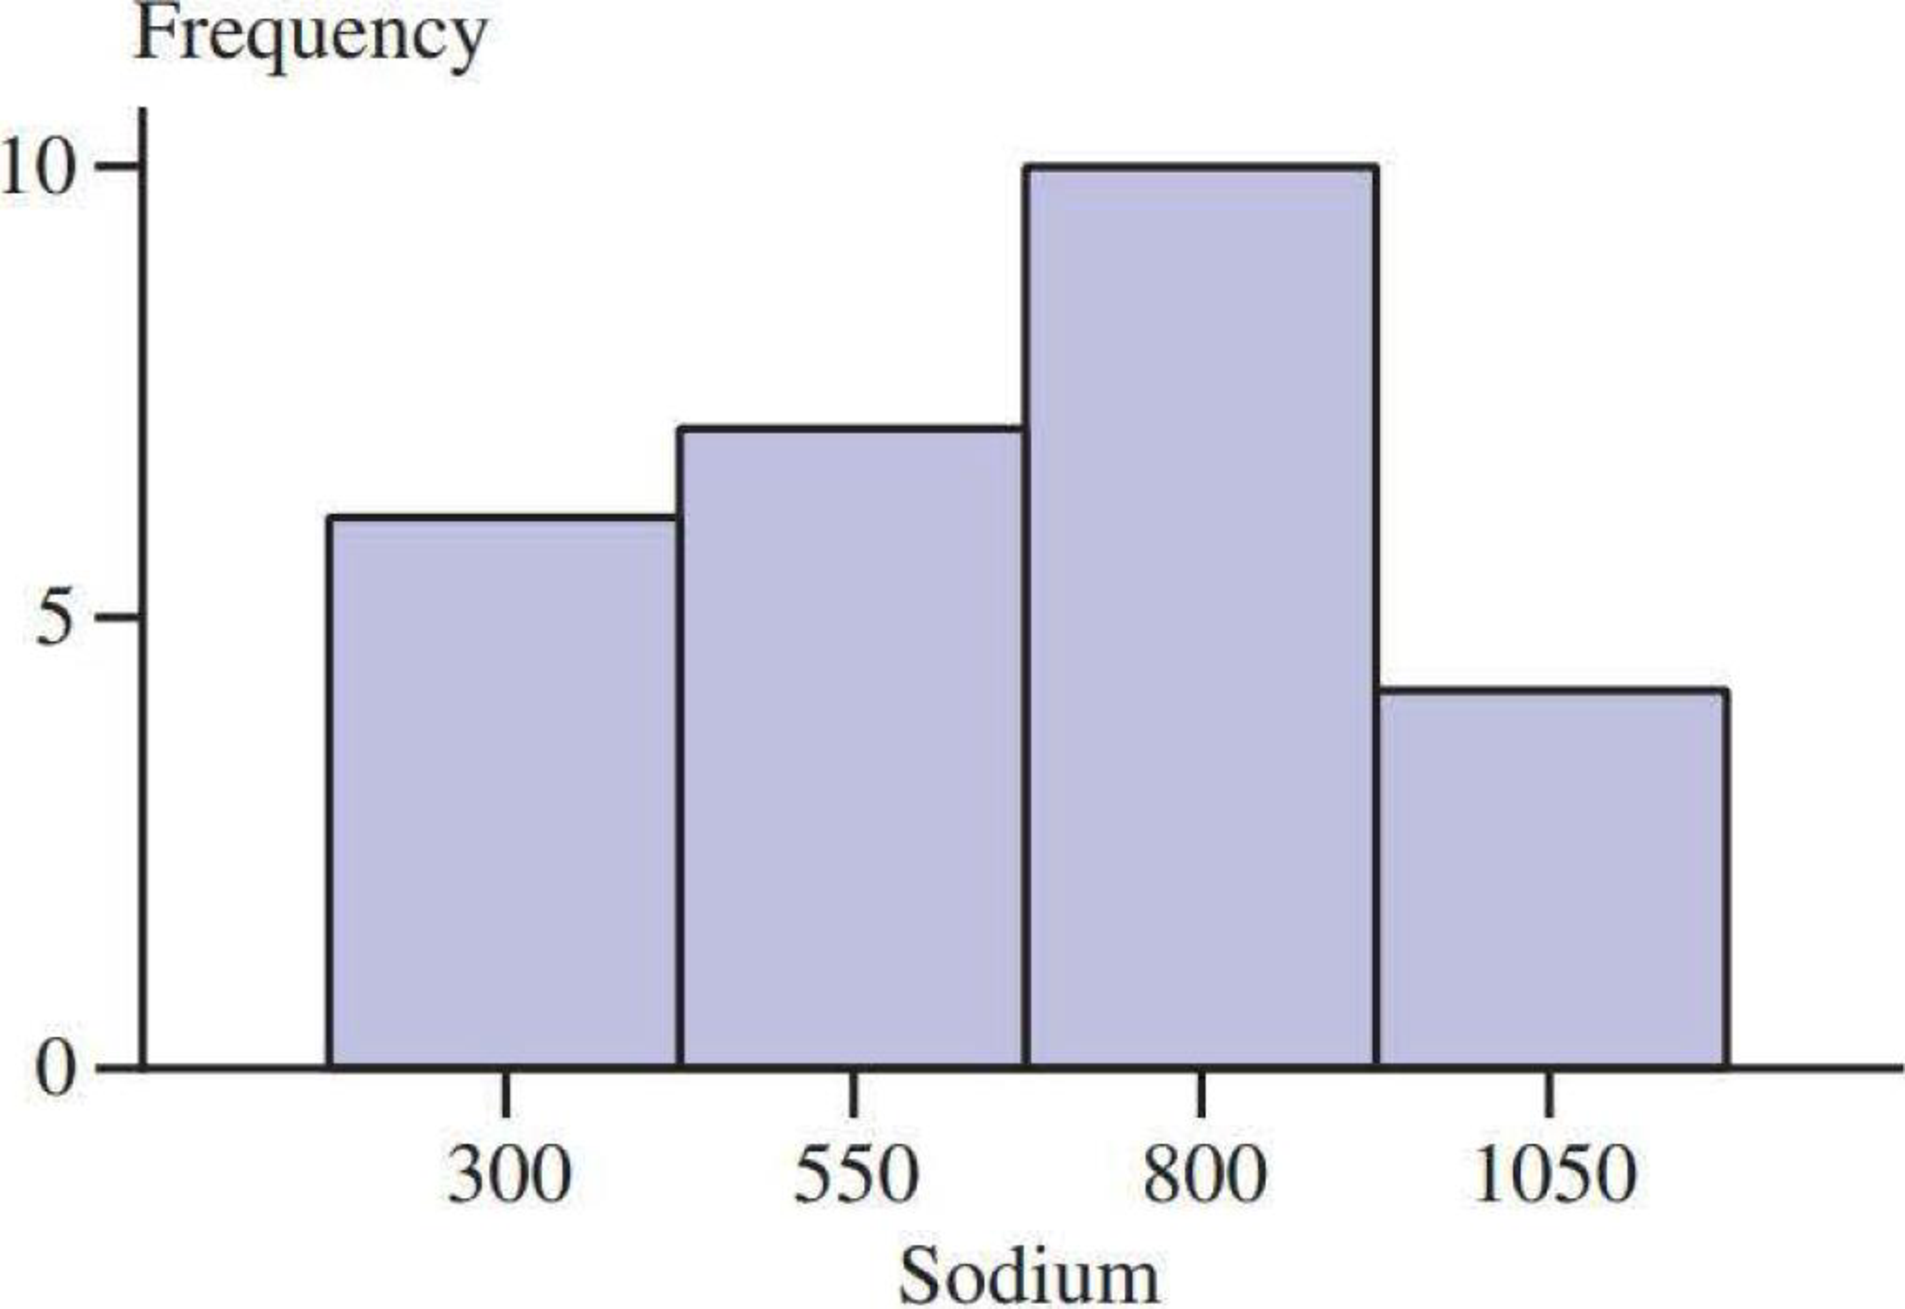
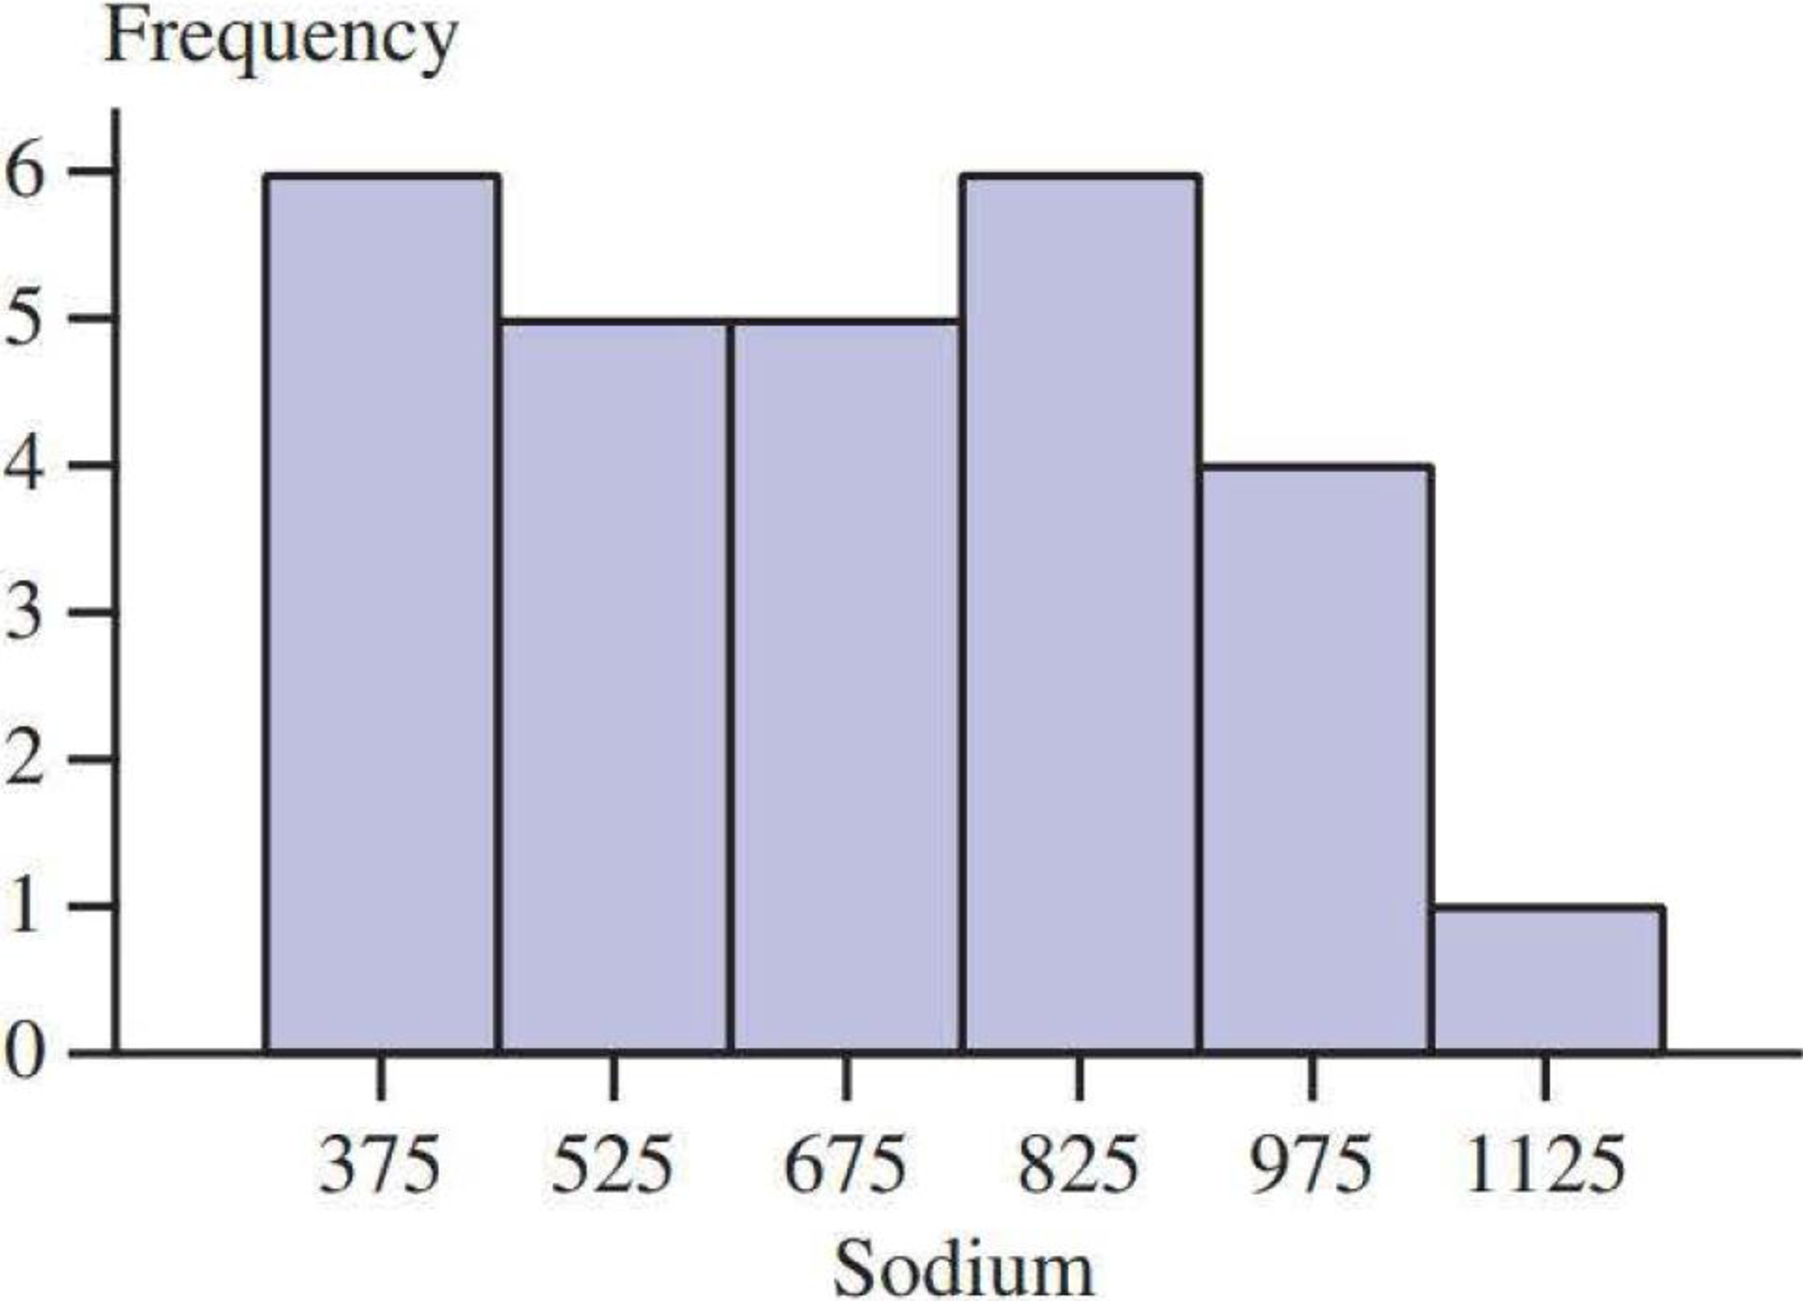
Two histograms for these data are shown below and on the next page.

  1. a. Do the two histograms give different impressions about the distribution of values?
  2. b. Use each histogram to determine the approximate proportion of observations that are less than 800, and compare to the actual proportion.

Chapter 3, Problem 70CR, Many nutritional experts have expressed concern about the high levels of sodium in prepared foods. , example  2

Chapter 3, Problem 70CR, Many nutritional experts have expressed concern about the high levels of sodium in prepared foods. , example  3

a.

Expert Solution
Check Mark
To determine

Check whether the interpretations of two histograms are different.

Answer to Problem 70CR

Yes, the two histograms give different impressions about the data of sodium content.

Explanation of Solution

The data represents the sodium content per frozen meal.

Skewness:

In statistics, skewness is a measure by which anyone can measure the asymmetrical behavior of a distribution.

A distribution is said to be symmetric, when its mean, median, and mode are the same. In other words it can be said that, the length of the curve of the left-hand tail will be a mirror image of the right-hand tail.

Therefore, the shape of a distribution can be identified by using the measure of skewness.

Left-skewed:

For a left-skewed distribution, Mean<Median<Mode. Moreover, the data will monotonically decrease after attaining the maximum and if the left hand side of the curve is larger than the right hand side, then it is called a left-skewed distribution. This is also called as negatively-skewed distribution.

Right-skewed:

For a right-skewed distribution, Mean > Median > Mode. Moreover, the data will monotonically increase after attaining the maximum and if the right hand side of the curve is larger than the left hand side, then it is called a right-skewed distribution. This is also called as positively-skewed distribution.

Since, the length of the curve of left-hand tail is greater than the right-hand tail, the first histogram indicates that, the distribution of sodium content is negatively skewed.

Since, the length of the curve of right-hand tail is greater than the left-hand tail, the second histogram indicates that, the distribution of sodium content is positively skewed.

Thus, the two histograms give different impressions about the data of sodium content.

b.

Expert Solution
Check Mark
To determine

Find the proportion of observations that are less than 800 from the first histogram.

Compute the proportion of observations that are less than 800 from the second histogram.

Answer to Problem 70CR

The proportion of observations that are less than 800 from the first histogram is 0.6667.

The proportion of observations that are less than 800 from the second histogram is 0.6667.

Explanation of Solution

The general formula for the relative frequency or proportion is,

RelativeFrequency or proportion = FrequencyTotal frequency

First histogram:

From the first histogram display, it can be seen that the frequency of the sodium content that is less than 800 is (6+7+(0.5×10))

The proportion of sodium content that is less than 800 is obtained as:

Substituting the values of sodium content that is less than “18” as the frequency and total frequency as “27”,

{RelativeFrequency or proportionofsodium content less than 800}=1827=0.6667

Thus, nearly 66.67% of sodium content is less than 800.

Second histogram:

The Objective is to find the frequency of sodium content that is less than 800.

The class width of class intervals is 150. The fourth interval is between 750 and 900.

The approximate range of less than 800 is 1/3rd part of the class interval 750 and 900.

Hence, the frequency of the sodium content that is less than 800 is (6+5+5+(63)).

The proportion of sodium content that is less than 800 is obtained as:

Substituting the values of sodium content that is less than “18” as the frequency and total frequency as “27”,

{RelativeFrequency or proportionofsodium content less than 800}=1827=0.6667

Thus, nearly 66.67% of sodium content is less than 800.

Want to see more full solutions like this?

Subscribe now to access step-by-step solutions to millions of textbook problems written by subject matter experts!

Chapter 3 Solutions

INTRO.TO STATS.+DATA ANALYS. W/WEBASSI

Ch. 3.1 - Prob. 11ECh. 3.1 - Prob. 12ECh. 3.1 - An article about college loans (New Rules Would...Ch. 3.1 - Prob. 14ECh. 3.2 - Prob. 15ECh. 3.2 - Prob. 16ECh. 3.2 - Prob. 17ECh. 3.2 - The article Economy Low, Generosity High (USA...Ch. 3.2 - Prob. 19ECh. 3.2 - A report from Texas Transportation Institute...Ch. 3.2 - The percentage of teens not in school or working...Ch. 3.3 - Prob. 22ECh. 3.3 - The accompanying data on annual maximum wind speed...Ch. 3.3 - The accompanying relative frequency table is based...Ch. 3.3 - Prob. 25ECh. 3.3 - Medicares new medical plans offer a wide range of...Ch. 3.3 - The following two relative frequency distributions...Ch. 3.3 - Prob. 28ECh. 3.3 - The report Trends in College Pricing 2012...Ch. 3.3 - An exam is given to students in an introductory...Ch. 3.3 - The accompanying frequency distribution summarizes...Ch. 3.3 - Example 3.19 used annual rainfall data for...Ch. 3.3 - Prob. 33ECh. 3.3 - Prob. 34ECh. 3.3 - Prob. 35ECh. 3.3 - Prob. 36ECh. 3.3 - Using the five class intervals 100 to 120, 120 to...Ch. 3.4 - Prob. 38ECh. 3.4 - Consumer Reports Health (consumerreports.org) gave...Ch. 3.4 - Prob. 40ECh. 3.4 - Prob. 41ECh. 3.4 - Prob. 42ECh. 3.4 - Prob. 43ECh. 3.4 - Prob. 44ECh. 3.4 - The accompanying time series plot of movie box...Ch. 3.5 - The accompanying comparative bar chart is similar...Ch. 3.5 - Prob. 47ECh. 3.5 - The figure at the top right of the next page is...Ch. 3.5 - The two graphical displays below are similar to...Ch. 3.5 - The following graphical display is similar to one...Ch. 3.5 - Explain why the following graphical display...Ch. 3 - Prob. 52CRCh. 3 - Prob. 53CRCh. 3 - Prob. 54CRCh. 3 - The Connecticut Agricultural Experiment Station...Ch. 3 - The stem-and-leaf display of Exercise 3.55 uses...Ch. 3 - Prob. 57CRCh. 3 - Prob. 58CRCh. 3 - Does the size of a transplanted organ matter? A...Ch. 3 - Prob. 60CRCh. 3 - Prob. 61CRCh. 3 - Prob. 62CRCh. 3 - The article Tobacco and Alcohol Use in G-Rated...Ch. 3 - Prob. 64CRCh. 3 - Prob. 65CRCh. 3 - Prob. 66CRCh. 3 - Prob. 67CRCh. 3 - Prob. 68CRCh. 3 - Prob. 69CRCh. 3 - Many nutritional experts have expressed concern...Ch. 3 - Americium 241 (241Am) is a radioactive material...Ch. 3 - Does eating broccoli reduce the risk of prostate...Ch. 3 - An article that appeared in USA TODAY (August 11,...Ch. 3 - Sometimes samples are composed entirely of...Ch. 3 - Prob. 4CRECh. 3 - More than half of Californias doctors say they are...Ch. 3 - Based on observing more than 400 drivers in the...Ch. 3 - An article from the Associated Press (May 14,...Ch. 3 - Prob. 8CRECh. 3 - Prob. 9CRECh. 3 - Prob. 10CRECh. 3 - The article Determination of Most Representative...Ch. 3 - The paper Lessons from Pacemaker Implantations...Ch. 3 - How does the speed of a runner vary over the...Ch. 3 - Prob. 14CRECh. 3 - One factor in the development of tennis elbow, a...Ch. 3 - An article that appeared in USA TODAY (September...
Knowledge Booster
Background pattern image
Statistics
Learn more about
Need a deep-dive on the concept behind this application? Look no further. Learn more about this topic, statistics and related others by exploring similar questions and additional content below.
Recommended textbooks for you
Text book image
Glencoe Algebra 1, Student Edition, 9780079039897...
Algebra
ISBN:9780079039897
Author:Carter
Publisher:McGraw Hill
The Shape of Data: Distributions: Crash Course Statistics #7; Author: CrashCourse;https://www.youtube.com/watch?v=bPFNxD3Yg6U;License: Standard YouTube License, CC-BY
Shape, Center, and Spread - Module 20.2 (Part 1); Author: Mrmathblog;https://www.youtube.com/watch?v=COaid7O_Gag;License: Standard YouTube License, CC-BY
Shape, Center and Spread; Author: Emily Murdock;https://www.youtube.com/watch?v=_YyW0DSCzpM;License: Standard Youtube License