
Videos
A Quant jock from your firm used a linear
- Based on these estimates, write an equation that summarizes the demand for the firm’s product.
- Which regression coefficients are statistically significant at the 5 percent level?
- Comment on how well the regression line fits the data.
(a)
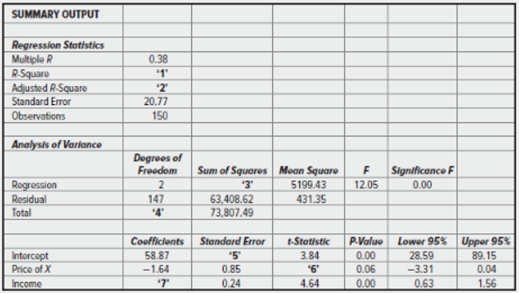
In the given table, the missing values that need to be found are:
- R-square
- Adjusted R-square
- Sum of Squares of regression
- Degree of freedom
- Standard error of Intercept
- t-statistic for price of X
- coefficient estimate of income.
To find the values of these missing terms, we need to go through the following steps:
1) R-square is computed as the ratio of the explained sum of squares of the regression to the total sum of squared errors. That is,
From the given information Sum of Squares of regression can be calculated,
The value of Sum of Squares is 10,398.87
By putting this value in formula of R-square, we get
The value of R-square is 0.141
2) The formula of adjusted R-square is:
Where r-square = 0.141
K= 3 and
n= 150
by putting these values in the formula, we get
Therefore, the value of the adjusted r-square is 0.129.
3) the value of Sum of Squares of regression is equal to 10,398.87.
4)the total degree of freedom is the sum of degree of freedom for regression and degree of freedom for residual.
Total degree of freedom = 147+2
= 149
Therefore, the value of the total degree of freedom is 149.
5) The standard error of intercept
In the table value of t-statistic and parameter, a is given. By putting these values in t-statistic formula we get,
Therefore, the value of the standard error of the intercept is equal to 15.33.
6) By using the value of coefficient and standard error we get t-statistic.
Therefore, the value of t-statistic for the price of X is equal to -1.93.
7)by using the same formula of t-statistic, the coefficient estimates of income can be found.
When we put the given information in the formula, we get
Therefore, the value of the coefficient estimate of income is equal to 1.1136.
Based on these estimates, the linear demand function of regression model.
Explanation of Solution
The demand function of is:
Here, Px is the price of good X and M is the income.
(b)
The estimates that are statistically different from zero.
Explanation of Solution
If the absolute value of the t-statistics is greater than or equal to 2, then the corresponding parameter estimate is statistically different from zero.
From the computed values and table, we have these details:
| t-statistic | |
| Intercept | 3.84 |
| Price of X | -1.93 |
| Income | 4.64 |
Since the absolute value of t-statistic for intercept and income is greater than 2, the estimated coefficient of the intercept and income at 5% significant level are statistically different from zero.
(c)
The question requires to find how well this model fit for the data.
Explanation of Solution
he values of R-square and adjusted r-square is the measurement of goodness of fit to a model. Here the value of adjusted r-square is not very different from the value of r-square. They are:
R-square = 0.141
Adjusted R-square = 0.129
The values of both the estimates are very small that means the regression equation is not able to explain the dependent variable values. Therefore, the regression line is not a good fit for the data.
Want to see more full solutions like this?
Chapter 3 Solutions
MANAGERIAL ECONOMICS & BUSINESS STRATEGY


- The Stopdecay Company sells an electric toothbrush for $25. Its sales have averaged 8,000 units per month over the past year. Recently, its closest competitor, Decayfigh ter, reduced the price of its electric toothbrush from $35 to $30. As a result, Stopde cays sales declined by 1,500 units per month. What is the arc cross elasticity of demand between Stopdecays toothbrush and Decayfighters toothbrush? What does this indicate about the relationship between the two products? If Stopdecay knows that the arc price elasticity of demand for its toothbrush is 1.5, what price would Stopdecay have to charge to sell the same number of units as it did before the Decayfighter price cut? Assume that Decayfighter holds the price of its toothbrush constant at $30. What is Stopdecays average monthly total revenue from the sale of electric toothbrushes before and after the price change determined in part (b)? Is the result in part (c) necessarily desirable? What other factors would have to be taken into consideration?arrow_forward(Calculating Price Elasticity of Demand) Suppose that 50 units of a good are demanded at a price of Si per unit. A reduction in price to $0.20 results in an increase in quantity demanded to 70 units. Using the midpoint formula, show that these data yield a price elasticity of 0.25. By what percentage would a 10 percent rise in the price reduce the quantity demanded, assuming price elasticity remains constant along the demand curve?arrow_forwardFor this question and the next few following, you should use the dataset below. Over the range from $4 to $6, Qd goes from 48 to 44. Using this range of prices and quantities, you should calculate the coefficient of price elasticity of demand. In the box labeled A1, the coefficient of price elasticity of demand is: 4 .22 2 .33arrow_forward
- Given the demand equation, Q = 120000 -10P2 for this equation, write the expression for the point price elasticity of demand as a function of P Over what range of the prices is the demand inelastic?arrow_forwardThe REDY Company produces a specialty cement used in the construction of roads. REDY is a price-setting firm and estimates the demand for its cement using a demand function in the linear form: Q = f( P, M, PR) where Qc = demand for cement/month (in yards) Pc = the price of cement per yard, M = country’s tax revenues per capita, and PR = the price of asphalt per yard. The manager of REDY obtained the following results in her attempt to estimate the demand for cement in the succeeding months. The results are presented below: DEPENDENT VARIABLE Qc R- SQUARE F-RATIO P-VALUE ON F OBSERVATIONS 64 0.8093 84.872 0.0001 VARIABLE PARAMETER ESTIMATE STANDARD ERROR T-RATIO P-VALUE INTERCEPT 8.20 4.01 2.04 0.0461 PC -3.54 1.64 -2.16 0.0357 M…arrow_forwardA sporting goods store has estimated the demand for a popular brand of running shoes as given in the table below. Price per unit (OMR) Shoe sales per week 60 100 50 200 40 300 30 400 20 500 10 600 Graphically present the table to get a demand curve. If the store charges a price of 50 OMR, then increases this price to 60 OMR, estimate price elasticity of demand. Analyze the total revenue before and after the price change.arrow_forward
- The Stopdecay Company sells an electric toothbrush for $25. Its sales have averaged 8,000 units per month over the past year. Recently, its closest competitor, Decayfighter, reduced the price of its electric toothbrush from $35 to $30. As a result, Stopdecay’s sales declined by 1,500 units per month.a. What is the arc cross elasticity of demand between Stopdecay’s toothbrush and Decayfighter’s toothbrush? What does this indicate about the relationship between the two products?b. If Stopdecay knows that the arc price elasticity of demand for its toothbrush is −1.5, what price would Stopdecay have to charge to sell the same number of units as it did before the Decayfighter price cut? Assume that Decayfighter holds the price of its toothbrush constant at $30.c. What is Stopdecay’s average monthly total revenue from the sale of electric toothbrushes before and after the price change determined in part (b)?d. Is the result in part (c) necessarily desirable? What other factors would have to…arrow_forwardThe Stopdecay Company sells an electric toothbrush for $25. Its sales have averaged 8,000 units per month over their past year. Recently, its closest competitor, Decayfighter, reduced the price of its electric toothbrush from $35 to $30. As a result, Stopdecay’s sales declined by 1,500 units per month. a) What is the arc cross elasticity of demand between Stopdecay’s toothbrush and Decayfighter’s toothbrush? What does this indicate about the relationship between the two products?arrow_forwardTo calculate the price elasticity of supply using the midpoint method, you would use the following approach:Group of answer choices % change in price / % change in quantity Price times quantity % change in quantity minus the % change in price % change in quantity / % change in pricearrow_forward
- All questions utilize the multivariate demand function for Smooth Sailing sailboats in C6 on text page 83. Compute to three decimal places. Initial values are: PX = $9500 PY = $10000 I = $15000 A = $170000 W = 160 This function is: Qs = 89830 -40PS +20PX +15PY +2I +.001A +10W 1.(a). Use the above to calculate the arc price elasticity of demand between PS = $9000 decreasing to PS = $8000. The arc elasticity formula is: 1.(b). Judging from the computation in (a), do you expect the revenue resulting from the decrease in Ps to $8000 to increase, remain the same, or decrease relative to the revenue at Ps = $9000. (Hint: see the table on page 65 of Truett). Explain your choice. 1.(c). Calculate the point elasticity of demand for Smooth Sailing sailboats at PS = $9000 (which should make Qs = 101600). The formula is: 1.(d). Does this elasticity value indicate that Smooth Sailing demand is relatively responsive to changes in the price of these sailboats? Explain…arrow_forwardYou are an Economics consultant at Economics 4U, a small consulting firm that helps its clients to use Economics knowledge for better business decision-making. You have been approached by a new client, Mr. PD Smith, a product manufacturer, to conduct research on the price elasticity of demand, income elasticity of demand and the price elasticity of supply for his product category. The manufacturer would like to obtain a better understanding of the concept of elasticity and how to use this knowledge to make better strategic decisions about his product.Present your findings in a report that provides the following information: • Introduction Explain the purpose of your report and identify the product you have chosen (Provide a brief explanation of the product category if it is one that is not well known).(+- ¼ page)arrow_forwardYou are an Economics consultant at Economics 4U, a small consulting firm that helps its clients to use Economics knowledge for better business decision-making. You have been approached by a new client, Mr. PD Smith, a product manufacturer, to conduct research on the price elasticity of demand, income elasticity of demand and the price elasticity of supply for his product category. The manufacturer would like to obtain a better understanding of the concept of elasticity and how to use this knowledge to make better strategic decisions about his product. Present your findings in a report that provides the following information: Price elasticity of demand Identify the price elasticity of demand coefficient for the product (based on your own research) and what it reveals about the product. Also identify and discuss the factors that have determined that particular elasticity coefficient. Use a graph to illustrate the relevant category of price elasticity of demand.(+- 2 pages)arrow_forward

 Managerial Economics: Applications, Strategies an...EconomicsISBN:9781305506381Author:James R. McGuigan, R. Charles Moyer, Frederick H.deB. HarrisPublisher:Cengage Learning