
Biological Science (6th Edition)
6th Edition
ISBN: 9780321976499
Author: Scott Freeman, Kim Quillin, Lizabeth Allison, Michael Black, Emily Taylor, Greg Podgorski, Jeff Carmichael
Publisher: PEARSON
expand_more
expand_more
format_list_bulleted
Videos
Textbook Question
Chapter 30, Problem 15PIAT
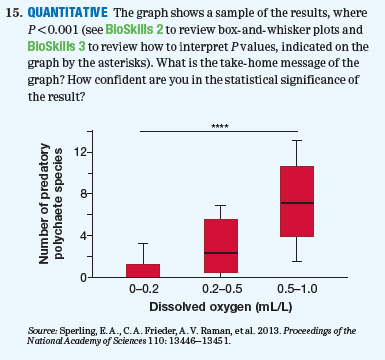
QUANTITATIVE The graph shows a sample of the results, where P<0.001 (see BioSkllls 2 to review box-and-whisker plots and BioSkills 3 to review how to interpret P values, indicated on the graph by the asterisks). What is the take-home message of the graph? How confident are you in the statistical significance of the result?
Expert Solution & Answer
Want to see the full answer?
Check out a sample textbook solution
Students have asked these similar questions
Use Verbal description of results from graph and then Interpret the graph for Effect of Food Density sccenario in foraging lab. The interpretations must include
Were the results expected and Did they support the hypotheses? If so, state the biological significance of the results from graph. If the results deviated significantly from expected results, discuss the hypotheses onthe basis of expected results and include an explanation of why this might be so. Lastly, state the conclusions drawn from the experiment and their biological relevance.
Hypothesis: higher food density corresponds to an extended duration of foraging.
Based on the image below, briefly write two (2) conclusions from this process.
Using the web, find a research report that uses the Grounded Theory Method. Briefly, what are the study design and main findings?
Chapter 30 Solutions
Biological Science (6th Edition)
Ch. 30 - 1. What synapomorphy (shared, derived trait)...Ch. 30 - 2. In a tube-within-a-tube body plan, what is the...Ch. 30 - True or false? Many new major animal body plans...Ch. 30 - Prob. 4TYKCh. 30 - 5. Why is it ecologically significant that animals...Ch. 30 - Prob. 6TYUCh. 30 - 7. CAUTION Evaluate this statement: Animals...Ch. 30 - 8. Which of the following is an example of...Ch. 30 - Suppose that a gene originally identified in...Ch. 30 - Some sea anemones can produce large colonies by...
Ch. 30 - Why did animal phyla appear so suddenly during the...Ch. 30 - Sperling and Knoll’s approach was to compare the...Ch. 30 - 13. Which of the following traits would help the...Ch. 30 - 14. PROCESS OF SCIENCE The researchers analyzed...Ch. 30 - QUANTITATIVE The graph shows a sample of the...Ch. 30 - Sponges lived in low-oxygen oceans before the...
Knowledge Booster


Learn more about
Need a deep-dive on the concept behind this application? Look no further. Learn more about this topic, biology and related others by exploring similar questions and additional content below.Similar questions
- compare and contrast Qualitative from Quantitative Approach using a venn diagramarrow_forwardBriefly Interpret the Chi sqaure data and the graph.arrow_forwardHere are some examples of real research topics.For each one, can you name the unit of analysis?(The answers are at the end of this chapter.)a. Women watch TV more than men becausethey are likely to work fewer hours outsidethe home than men. . . . Black people watchan average of approximately three-quartersof an hour more television per day thanwhite people. (Hughes 1980: 290)arrow_forward
- From the given graph, draw conclusions, practical implications, theoretical implications and methodological implications.arrow_forwardState a claim about a concern that is a problem. USE EVIDENCE FROM THE GRAPH TO SUPPORT YOUR CLAIM.arrow_forwardinterpret these results and explain these as detailed as possible include an explanation of why the results demonstrate what they do and possible explanations for thisarrow_forward
- Using my chart below describe how your data supported or did not support your predictions?arrow_forwardDraw the Mchelis Menton plot and the Line Weaver Burk Plot using the data given below and find the Vmax and Km from the Plot.arrow_forwarda. How will approach for finding to support your research project.arrow_forward
- Calculate the odds ratio for 'ate litchi' (table 2) and interpret the result Calculate the odds ratio for 'NOT routinely wash vegetables and fruits' and interpret the resultarrow_forwardUse Verbal description of results from graph and then Interpret the graph for Speacialization scenario in foraging lab. The interpretations must include: Were the results expected and Did they support the hypotheses? If so, state the biological significance of the results from graph. If the results deviated significantly from expected results, discuss the hypotheses onthe basis of expected results and include an explanation of why this might be so. Lastly, state the conclusions drawn from the experiment and their biological relevance. Hypothesis: Within the context of specialization, foragers will exhibit differences in foraging efficiency between pure and mixed food types, with the expectation that they will perform more efficiently when searching for their preferred pure food type compared to mixed food. This difference in efficiency may be reflected in factors such as foraging times, success rates, or other relevant measures.arrow_forwardwhat will be the trend in the graph of a an experimental result of potato slides whose % initial weight are positive.arrow_forward
arrow_back_ios
SEE MORE QUESTIONS
arrow_forward_ios
Recommended textbooks for you
 Case Studies In Health Information ManagementBiologyISBN:9781337676908Author:SCHNERINGPublisher:Cengage
Case Studies In Health Information Management
Biology
ISBN:9781337676908
Author:SCHNERING
Publisher:Cengage
DNA Use In Forensic Science; Author: DeBacco University;https://www.youtube.com/watch?v=2YIG3lUP-74;License: Standard YouTube License, CC-BY
Analysing forensic evidence | The Laboratory; Author: Wellcome Collection;https://www.youtube.com/watch?v=68Y-OamcTJ8;License: Standard YouTube License, CC-BY