
Statistical Reasoning for Everyday Life, Books a la Carte Edition, Plus NEW MyLab Statistics with Pearson eText -- Access Card Package (5th Edition)
5th Edition
ISBN: 9780134668390
Author: Jeffrey O. Bennett, William L. Briggs, Mario F. Triola
Publisher: PEARSON
expand_more
expand_more
format_list_bulleted
Videos
Textbook Question
Chapter 3.1, Problem 10E
Pulse Rates of Females. In Exercises 9–12, refer to the following frequency table of pulse rates of a sample of females.
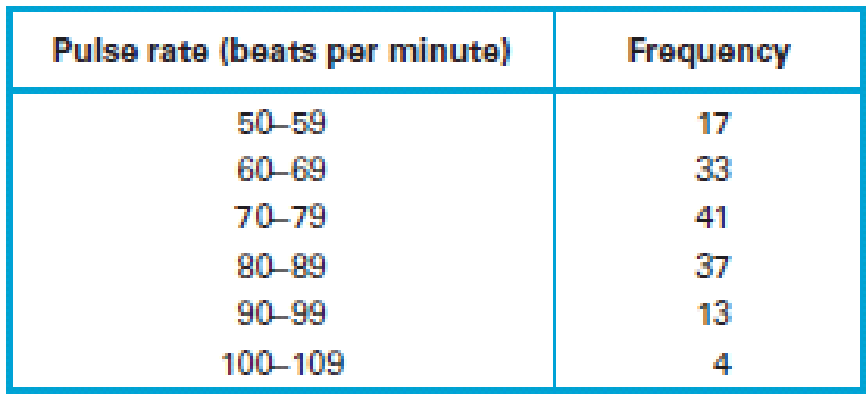
10. List the relative frequencies that correspond to the given frequencies.
Expert Solution & Answer
Want to see the full answer?
Check out a sample textbook solution
Students have asked these similar questions
Look at the relative frequency table above. What is P(X = 3)?
At a meeting of information systems for regional offices of a national company, a survey was taken to determine the number of employees the officers supervise in the operation of their departments, where X is the number of employees overseen by each information systems officer.
Table
X_____________________ Frequency
1 _____________________7
2 _____________________5
3 _____________________11
4 _____________________8
5 _____________________9
Referring to the Table above, how many regional officers are represented in the survey results?
Exercise 8. A table of some of the relative frequencies computed from a data set is?x 1 2 3 4?/? 0.3 ? 0.2 0.1The number ? is yet to be computed. Finish the table and construct the relative frequency histogram for the data set.
Chapter 3 Solutions
Statistical Reasoning for Everyday Life, Books a la Carte Edition, Plus NEW MyLab Statistics with Pearson eText -- Access Card Package (5th Edition)
Ch. 3.1 - Frequency Table. What is a frequency table? How...Ch. 3.1 - Relative Frequency. What do we mean by relative...Ch. 3.1 - Cumulative Frequency. What do we mean by...Ch. 3.1 - Binning. What is the purpose of binning? Give an...Ch. 3.1 - Does It Make Sense? For Exercises 58, determine...Ch. 3.1 - Does It Make Sense? For Exercises 58, determine...Ch. 3.1 - Does It Make Sense? For Exercises 58, determine...Ch. 3.1 - Does It Make Sense? For Exercises 58, determine...Ch. 3.1 - Pulse Rates of Females. In Exercises 912, refer to...Ch. 3.1 - Pulse Rates of Females. In Exercises 912, refer to...
Ch. 3.1 - Pulse Rates of Females. In Exercises 912, refer to...Ch. 3.1 - Pulse Rates of Females. In Exercises 912, refer to...Ch. 3.1 - Birth Days. Births at a hospital in New York State...Ch. 3.1 - Clinical Trial. As part of a clinical trial, the...Ch. 3.1 - Train Derailments. An analysis of 50 train...Ch. 3.1 - Analysis of Last Digits. Weights of respondents...Ch. 3.1 - Academy Award-Winning Male Actors. The following...Ch. 3.1 - Body Temperatures. The following data show the...Ch. 3.1 - Loaded Die. An experiment was conducted in which a...Ch. 3.1 - Interpreting Family Data. Consider the following...Ch. 3.1 - Computer Keyboards. The traditional keyboard...Ch. 3.1 - Double Binning. The students in a statistics class...Ch. 3.2 - Distribution Graph. What is a distribution of...Ch. 3.2 - Qualitative Data. Which types of graph described...Ch. 3.2 - Yearly Data. Which type of graph described in this...Ch. 3.2 - Histogram and Stemplot. Assume that a data set is...Ch. 3.2 - Prob. 5ECh. 3.2 - Does It Make Sense? For Exercises 58, determine...Ch. 3.2 - Does It Make Sense? For Exercises 58, determine...Ch. 3.2 - Does It Make Sense? For Exercises 58, determine...Ch. 3.2 - Histogram. Children living near a smelter in Texas...Ch. 3.2 - Understanding Data. Suppose you have a list of...Ch. 3.2 - Most Appropriate Display. Exercises 1114 describe...Ch. 3.2 - Most Appropriate Display. Exercises 1114 describe...Ch. 3.2 - Most Appropriate Display. Exercises 1114 describe...Ch. 3.2 - Most Appropriate Display. Exercises 1114 describe...Ch. 3.2 - Academy Award-Winning Male Actors. Exercise 17 in...Ch. 3.2 - Body Temperatures. Exercise 18 in Section 3.1...Ch. 3.2 - Job Hunting. A survey was conducted to determine...Ch. 3.2 - Job Hunting. Refer to the data given in Exercise...Ch. 3.2 - Prob. 19ECh. 3.2 - Job Application Mistakes Construct a Pareto chart...Ch. 3.2 - Dotplot. Refer to the QWERTY data in Exercise 21...Ch. 3.2 - Dotplot. Refer to the Dvorak data in Exercise 21...Ch. 3.2 - Stemplot. Construct a stemplot of these test...Ch. 3.2 - Stemplot. Listed below are the lengths (in...Ch. 3.2 - DJIA. Listed below (in order by row) are annual...Ch. 3.2 - Home Runs. Listed below (in order by row) are the...Ch. 3.3 - Multiple Data. Briefly describe how each of the...Ch. 3.3 - Prob. 2ECh. 3.3 - Prob. 3ECh. 3.3 - Prob. 4ECh. 3.3 - Does It Make Sense? For Exercises 58, determine...Ch. 3.3 - Does It Make Sense? For Exercises 58, determine...Ch. 3.3 - Does It Make Sense? For Exercises 58, determine...Ch. 3.3 - Does It Make Sense? For Exercises 58, determine...Ch. 3.3 - Public and Private Colleges. The stack plot in...Ch. 3.3 - Home Prices by Region. The graph in Figure 3.21...Ch. 3.3 - Gender and Salary. Consider the display in Figure...Ch. 3.3 - Marriage and Divorce Rates. The graph in Figure...Ch. 3.3 - Prob. 13ECh. 3.3 - College Degrees. The stack plot in Figure 3.25...Ch. 3.3 - Contour Map. For Exercises 17 and 18, refer to the...Ch. 3.3 - Prob. 18ECh. 3.3 - Prob. 19ECh. 3.3 - Prob. 20ECh. 3.3 - Infographic. For Exercises 21 and 22, refer to...Ch. 3.3 - Infographic. For Exercises 21 and 22, refer to...Ch. 3.3 - Creating Graphics. Exercises 2326 give tables of...Ch. 3.3 - Creating Graphics. Exercises 2326 give tables of...Ch. 3.3 - Firearms Fatalities. The following table...Ch. 3.3 - Prob. 26ECh. 3.4 - Perceptual Distortion. Use a ruler to measure the...Ch. 3.4 - Prob. 2ECh. 3.4 - Prob. 3ECh. 3.4 - Prob. 4ECh. 3.4 - Does It Make Sense? For Exercises 58, determine...Ch. 3.4 - Does It Make Sense? For Exercises 58, determine...Ch. 3.4 - Does It Make Sense? For Exercises 58, determine...Ch. 3.4 - Does It Make Sense? For Exercises 58, determine...Ch. 3.4 - Exaggerating a Difference. Weekly instruction time...Ch. 3.4 - Graph of Sounds. In a survey conducted by Kelton...Ch. 3.4 - Graph Dimensions. A newspaper used images of...Ch. 3.4 - Prob. 12ECh. 3.4 - Prob. 13ECh. 3.4 - DJIA. Figure 3.36 on the next page depicts the...Ch. 3.4 - Prob. 15ECh. 3.4 - Prob. 16ECh. 3.4 - Prob. 17ECh. 3.4 - Moores Law. In 1965, Intel cofounder Gordon Moore...Ch. 3.4 - Prob. 19ECh. 3.4 - Prob. 20ECh. 3.4 - Constant Dollars. The graph in Figure 3.41 shows...Ch. 3.4 - Prob. 22ECh. 3 - Listed below are measured weights (in pounds) of...Ch. 3 - Listed below are measured weights (in pounds) of...Ch. 3 - Listed below are measured weights (in pounds) of...Ch. 3 - Pie Chart for Sports Equipment. USA Today reported...Ch. 3 - Pareto Chart for Sports Equipment. Construct a...Ch. 3 - Bar Chart. Figure 3.43 shows the numbers of U.S....Ch. 3 - As a quality control manager at Ford Motor...Ch. 3 - As a quality control manager at Ford, you monitor...Ch. 3 - A stemplot is created with the braking distances...Ch. 3 - A dotplot of braking distances (in feet) of cars...Ch. 3 - The first category in a frequency table is 90100,...Ch. 3 - The first category in a relative frequency table...Ch. 3 - The third category in a frequency table has a...Ch. 3 - Prob. 8CQCh. 3 - When constructing a graph of the same categorical...Ch. 3 - Body Temperatures Listed below are body...Ch. 3 - Why are pictographs generally poor for depicting...Ch. 3 - Note that this graph plots six variables: two...Ch. 3 - Prob. 2.2FCh. 3 - Prob. 2.3F
Knowledge Booster


Learn more about
Need a deep-dive on the concept behind this application? Look no further. Learn more about this topic, statistics and related others by exploring similar questions and additional content below.Similar questions
- Every year, the students at a school are given a musical aptitude test that rates them from 0 (no musical aptitude) to 5 (high musical aptitude). This year's results were: Aptitude Score 0 1 2 3 4 5 Frequency 2 2 3 3 5 1 The average (mean) aptitude score: The median aptitude score:arrow_forwardThe following frequency distribution shows the various levels of demand for the Macbook Air over a particular 50 business days. Determine the average number of laptops sold per day. Number of laptops Frequency 0 14 1 8 2 8 3 12 4 5 5 3arrow_forwardOn occasion, medical studies need to model the proportion of the population that has a disease and compare that to observed frequencies of the disease actually occurring. Suppose the end-stage renal failure in south-west Wales was collected for different age groups. Do the data in the table show that the observed frequencies are in agreement with proportion of people in each age group? Test at the 1% level. Renal Failure Frequencies Age group 16-29 30-44 45-59 60-74 75+ Total Observed Frequencies 125 152 134 124 48 583 Expected Proportion 0.23 0.25 0.22 0.21 0.09 State the hypotheses.H0: The observed frequencies in agreement with proportion of people in each age group.Ha: The observed frequencies in agreement with proportion of people in each age group. Calculate the χ2 test statistic. Round expected values to two decimal places. Round χ2 to 3 decimal places.χ2 = Calculate the p-value. Round to 3 decimal places.p-value = State your decision.Since p-value α,…arrow_forward
- Every year, the students at a school are given a musical aptitude test that rates them from 0 (no musical aptitude) to 5 (high musical aptitude). This year's results were: Aptitude Score 0 1 2 3 4 5 Frequency 3 5 5 1 6 5 The average (mean) aptitude score is: (rounded to two decimal points)The median aptitude score:arrow_forwardA company collects data from 10,000 websites about how long it takes to load the site. The number of seconds it takes to fully load the website is summarized in the relative frequency table. seconds to load relative frequency 1.4–1.6 0.0003 1.6–1.8 0.0012 1.8–2.0 0.0053 2.0–2.2 0.0181 2.2–2.4 0.0442 2.4–2.6 0.0910 2.6–2.8 0.1555 2.8–3.0 0.1861 3.0–3.2 0.1938 3.2–3.4 0.1447 3.4–3.6 0.0923 3.6–3.8 0.0447 3.8–4.0 0.0166 4.0–4.2 0.0048 4.2–4.4 0.0012 4.4–4.6 0.0002 The relative frequency histogram summarizes the same data. Expand Image The mean time to load a website is 3 seconds and the standard deviation is 0.4 seconds. Would a normal distribution be a good model for this distribution? Explain your reasoning. What proportion of websites loaded within 1 standard deviation of the mean? What proportion of websites loaded within 2 standard deviations of the mean? What proportion of websites loaded within 1 standard deviation of 2.8 seconds?…arrow_forwardTime(x) Frequency (f) 7 10 8 5 9 8 10 9 11 3 12 4 13 2 14 1 Find the Mean, Median, Mode, and Range?arrow_forward
- Find the mean of the data from the frequency table: Value Frequency 0 6 1 0 2 6 3 8 4 9 5 6 Give your answer to two decimal places.arrow_forwardAn environmental organization releases an annual beach report card based on water quality. The grades for 20 beaches in three counties in a certain state during dry weather are given below. B A+ F A+ F C A+ A+ A+ A+ A+ B A+ B A+ C C A A+ A Summarize the dry weather grades by constructing a relative frequency distribution.arrow_forwardCompute this measure of central tendency and explain what this means in everyday language. The frequency table is given as: X Frequency proportion percent 0 7 0.35 35% 1 4 0.20 20% 2 3 0.15 15% 3 2 0.10 10% 5 1 0.05 5% 7 1 0.05 5% 8 1 0.05 5% 9 1 0.05 5% Total 20 1 100%arrow_forward
arrow_back_ios
arrow_forward_ios
Recommended textbooks for you
 Glencoe Algebra 1, Student Edition, 9780079039897...AlgebraISBN:9780079039897Author:CarterPublisher:McGraw Hill
 Linear Algebra: A Modern IntroductionAlgebraISBN:9781285463247Author:David PoolePublisher:Cengage Learning
Glencoe Algebra 1, Student Edition, 9780079039897...
Algebra
ISBN:9780079039897
Author:Carter
Publisher:McGraw Hill
Linear Algebra: A Modern Introduction
Algebra
ISBN:9781285463247
Author:David Poole
Publisher:Cengage Learning
How to make Frequency Distribution Table / Tally Marks and Frequency Distribution Table; Author: Reenu Math;https://www.youtube.com/watch?v=i_A6RiE8tLE;License: Standard YouTube License, CC-BY
Frequency distribution table in statistics; Author: Math and Science;https://www.youtube.com/watch?v=T7KYO76DoOE;License: Standard YouTube License, CC-BY
Frequency Distribution Table for Grouped/Continuous data | Math Dot Com; Author: Maths dotcom;https://www.youtube.com/watch?v=ErnccbXQOPY;License: Standard Youtube License