
Concept explainers
Videos
A. Problem Solving with Bar Graphs and Line Graphs
Driving under the Influence. A blood-alcohol level of 0.08% or higher makes driving illegal in the United States. The following bar graph shows how many drinks a person of a certain weight would need to consume in 1 hr in order to reach a blood-alcohol level of 0.08%. Note that a 12-oz beer, a 5-oz glass of wine, or a cocktail containing
Data: soberup.com and vsa.vassar.edu
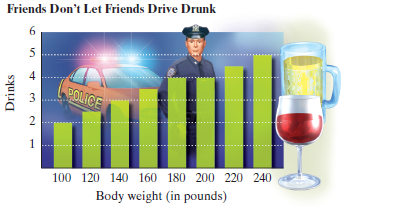
What can you conclude about the weight of someone who has consumed 4 drinks in 1 hr without reaching a blood-alcohol level of 0.08%?
Want to see the full answer?
Check out a sample textbook solution
Chapter 3 Solutions
MyLab Math with Pearson eText -- Standalone Access Card -- for Elementary and Intermediate Algebra: Concepts and Applications (7th Edition)


- Classify each of the following as nominal, ordinal, interval, or ratio data and explain. a. the time required to produce each car on an assembly line. b. the number of litres of water a family drinks in a month. c. the ranking of four student projects in your class after they have been designated as excellent, good, satisfactory, and poor. d. the telephone area code of clients in India. e. Explain the four groups of data in detail.arrow_forwardDrunk-Driving Fatalities. Drunk-driving fatalities represent the total number of people (occupants and non-occupants) killed in motor vehicle traffic crashes in which at least one driver had a blood alcohol content (BAC) of 0.08 or higher. The following graph is based on data published by the National Highway Traffic Safety Administration in Federal Highway Administration Annual Highway Statistics. a. What features of the graph are potentially misleading? b. Do you think that it was necessary to incorporate those features in order to display the data? c. What could be done to more correctly display the data?arrow_forward4.) The brand manager for a brand of toothpaste must plan a campaign designed to increase brand recognition. He wants to first determine the percentage of adults who have heard of the brand. How many adults must he survey in order to be 80% confident that his estimate is within six percentage points of the true population percentage? Complete parts (a) through (c) below. a) Assume that nothing is known about the percentage of adults who have heard of the brand. n= b) Assume that a recent survey suggests that about 80%of adults have heard of the brand. n=arrow_forward
 Algebra: Structure And Method, Book 1AlgebraISBN:9780395977224Author:Richard G. Brown, Mary P. Dolciani, Robert H. Sorgenfrey, William L. ColePublisher:McDougal Littell
 Holt Mcdougal Larson Pre-algebra: Student Edition...AlgebraISBN:9780547587776Author:HOLT MCDOUGALPublisher:HOLT MCDOUGAL
 Glencoe Algebra 1, Student Edition, 9780079039897...AlgebraISBN:9780079039897Author:CarterPublisher:McGraw Hill
 Functions and Change: A Modeling Approach to Coll...AlgebraISBN:9781337111348Author:Bruce Crauder, Benny Evans, Alan NoellPublisher:Cengage Learning