
Numerical Analysis
3rd Edition
ISBN: 9780134696454
Author: Sauer, Tim
Publisher: Pearson,
expand_more
expand_more
format_list_bulleted
Videos
Textbook Question
Chapter 3.1, Problem 1CP
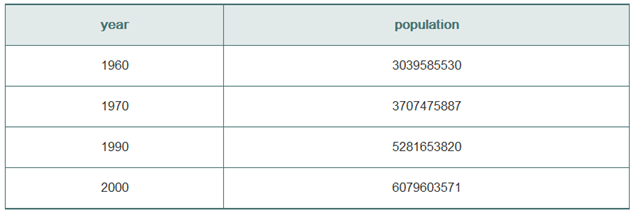
Apply the following world population figures to estimate the 1980 population, using (a) the straight line through the 1970 and 1990 estimates: (b) the parabola through the 1960, 1970, and 1990 estimates: and (c) the cubic curve through all four data points. Compare with the 1980 estimate of 4452584592.
Expert Solution & Answer
Want to see the full answer?
Check out a sample textbook solution
Students have asked these similar questions
Complete the survivorship table below by filling in the missing data. After that, plot the survivorship curve of the completed data.
The MAD for the forecast developed using a weighted 2-year moving average with weights of
0.350.35
and
0.650.65 is what?
The speed, in miles per hour, of 24 cars on a particular road are recorded and represented on the box-and-whiskers plot below. What is the maximum speed of the 24 drivers?
Chapter 3 Solutions
Numerical Analysis
Ch. 3.1 - Use Lagrange interpolation to find a polynomial...Ch. 3.1 - Use Newtons divided differences to find the...Ch. 3.1 - How many degree d polynomials pass through the...Ch. 3.1 - (a) Find a polynomial P(x) of degree 3 or less...Ch. 3.1 - (a) Find a polynomial P(x) of degree 3 or less...Ch. 3.1 - Write down a polynomial of degree exactly 5 that...Ch. 3.1 - Find P(0), where P(x) is the degree 10 polynomial...Ch. 3.1 - Let P(x) be the degree 9 polynomial that takes the...Ch. 3.1 - Give an example of the following, or explain why...Ch. 3.1 - Let P(x) be the degree 5 polynomial that takes the...
Ch. 3.1 - Let P1, P2, P3, and P4 be four different points...Ch. 3.1 - Can a degree 3 polynomial intersect a degree 4...Ch. 3.1 - Let P(x) be the degree 10 polynomial through the...Ch. 3.1 - Write down 4 noncollinear points (1,y1), (2,y2),...Ch. 3.1 - Write down the degree 25 polynomial that passes...Ch. 3.1 - List all degree 42 polynomials that pass through...Ch. 3.1 - The estimated mean atmospheric concentration of...Ch. 3.1 - Prob. 18ECh. 3.1 - Apply the following world population figures to...Ch. 3.1 - Write a version of Program 3.2 that is a MATLAB...Ch. 3.1 - Write a MATLAB function polyinterp.m that takes as...Ch. 3.1 - Remodel the sin1 calculator key in Program 3.3 to...Ch. 3.1 - (a) Use the addition formulas for sin and cos to...Ch. 3.2 - Find the degree 2 interpolating polynomial P2(x)...Ch. 3.2 - (a) Given the data points (1,0), (2,In2), (4,In4),...Ch. 3.2 - Assume that the polynomial P9(x) interpolates the...Ch. 3.2 - Consider the interpolating polynomial for...Ch. 3.2 - Assume that a function f(x) has been approximated...Ch. 3.2 - Assume that the polynomial P5(x) interpolates a...Ch. 3.2 - (a) Use the method of divided differences to find...Ch. 3.2 - Plot the interpolation error of the sin1 key from...Ch. 3.2 - The total world oil production in millions of...Ch. 3.2 - Use the degree 3 polynomial through the first four...Ch. 3.3 - List the Chebyshev interpolation nodes x1,...,xn...Ch. 3.3 - Find the upper bound for | (xx1)...(xxn) | on the...Ch. 3.3 - Assume that Chebyshev interpolation is used to...Ch. 3.3 - Answer the same questions as in Exercise 3, but...Ch. 3.3 - Find an upper bound for the error on [ 0,2 ] when...Ch. 3.3 - Assume that you are to use Chebyshev interpolation...Ch. 3.3 - Suppose you are designing the In key for a...Ch. 3.3 - Let Tn(x) denote the degree n Chebyshev...Ch. 3.3 - Determine the following values: (a) T999(1) (b)...Ch. 3.3 - Prob. 1CPCh. 3.3 - Prob. 2CPCh. 3.3 - Carry out the steps of Computer Problem 2 forIn x,...Ch. 3.3 - Let f(x)=e| x |, Compare evenly spaced...Ch. 3.3 - Prob. 5CPCh. 3.4 - Decide whether the equations form a cubic spline....Ch. 3.4 - Check the spline conditions for {...Ch. 3.4 - Find c in the following cubic splines. Which of...Ch. 3.4 - Find k1,k2,k3 in the following cubic spline. Which...Ch. 3.4 - How many natural cubic splines on [ 0,2 ] are...Ch. 3.4 - Find the parabolically terminated cubic spline...Ch. 3.4 - Solve equations 3.26 to find the natural cubic...Ch. 3.4 - Solve equations 3.26 to find the natural cubic...Ch. 3.4 - Prob. 9ECh. 3.4 - True or false: Given n=3 data points, the...Ch. 3.4 - (a) How many parabolically terminated cubic...Ch. 3.4 - How many not-a-knot cubic splines are there for...Ch. 3.4 - Find b1 and c3 in the cubic spline S(x)={...Ch. 3.4 - Prob. 14ECh. 3.4 - Prob. 15ECh. 3.4 - Prob. 16ECh. 3.4 - Prob. 17ECh. 3.4 - Prob. 18ECh. 3.4 - Prob. 19ECh. 3.4 - Discuss the existence and uniqueness of a...Ch. 3.4 - Prob. 21ECh. 3.4 - Prob. 1CPCh. 3.4 - Find and plot the not-a-knot cubic spline that...Ch. 3.4 - Find and plot the cubic spline S satisfying...Ch. 3.4 - Prob. 4CPCh. 3.4 - Prob. 5CPCh. 3.4 - Find and plot the cubic spline S satisfying...Ch. 3.4 - Prob. 7CPCh. 3.4 - Prob. 8CPCh. 3.4 - Find the clamped cubic spline that interpolates...Ch. 3.4 - Find the number of interpolation nodes in Computer...Ch. 3.4 - (a) Consider the natural cubic spline through the...Ch. 3.4 - Prob. 12CPCh. 3.4 - In a single plot, show the natural, not-a-knot,...Ch. 3.4 - Prob. 14CPCh. 3.4 - Prob. 15CPCh. 3.5 - Find the one-piece BĂ©zier curve (x(t),y(t))...Ch. 3.5 - Find the first endpoint two control points, and...Ch. 3.5 - Find the three-piece BĂ©zier curve forming the...Ch. 3.5 - Build a four-piece BĂ©zier spline that forms a...Ch. 3.5 - Describe the character drawn by the following...Ch. 3.5 - Describe the character drawn by the following...Ch. 3.5 - Find a one-piece BĂ©zier spline that has vertical...Ch. 3.5 - Find a one-piece Bezier spline that has a...Ch. 3.5 - Prob. 9ECh. 3.5 - Find the knots and control points for the...Ch. 3.5 - Prove the facts in (3.27), and explain how they...Ch. 3.5 - Given (x1,y1), (x2,y2), (x3,y3), and (x4,y4), show...Ch. 3.5 - Plot the cure in Exercise 7.Ch. 3.5 - Prob. 2CPCh. 3.5 - Plot the letter from BĂ©zier curves: (a) W (b) B...Ch. 3.5 - Use the bezierdraw.m program of Section 3.5 to...Ch. 3.5 - Revise the draw program to accept an n8 matrix of...Ch. 3.5 - Using the template above and your favorite text...Ch. 3.5 - Prob. 4SACh. 3.5 - Although font information was a closely guarded...Ch. 3.5 - Prob. 6SA
Knowledge Booster


Learn more about
Need a deep-dive on the concept behind this application? Look no further. Learn more about this topic, subject and related others by exploring similar questions and additional content below.Similar questions
- Report your results and state your conclusion based from your calculations.arrow_forwardWhat could be the resulting cross section?arrow_forwardIn a test of braking performance, a tire manufacturer measured the stopping distance for one of its tire models. On a test track, a car made repeated stops from 100 kilometres per hour. The test was run on both dry and wet pavement, with the accompanying results.arrow_forward
- Does the table above represent a porportion relationship. Explain whyarrow_forwardA man walks daily 84 minutes on a track. One day, his speed at each 6-minute interval is determined in feet/minute, by the following data. Time 0 6 12 18 24 60 36 42 48 Speed 124 134 148 156 147 133 121 109 99 Time 54 60 66 72 78 84 Speed 85 78 89 104 116 123 How long is the track? Also give a comparison by using different mode of approximation.arrow_forwardSolve the given data below:arrow_forward
- The following stem-and-leaf plot is constructed using data collected from the speed (km/h) of cars passing through an intersection. Data values were rounded to one decimal place.arrow_forward1. Comment on the relation between Height and Gestational Age using the scatterplot.arrow_forwardApproximate x to three significant figures.arrow_forward
- The following data represent the times in minutes required for 18 co-workers to commute to work. Create the key to be used in interpreting the stem and leaf plotarrow_forwardKaitlyn measures the upload speed in megabits per second of her home broadband internet connection during peak hours and off-peak hours. The results are provided in the accompanying table. Peak Off-Peak 5.83 5.14 6.05 6.80 7.14 6.98 3.54 5.77 5.45 7.27 5.90 6.62 5.81 6.19 4.82 6.08 6.37 6.59 4.65 5.58 5.30 7.41 6.48 6.26 5.96 6.37 5.79 6.31 6.84 6.55 5.06 4.95 5.61 7.03 6.45 6.77 Examine the results of Kaitlyn's test to determine the statements that compare the medians and interquartile ranges of the data sets to each other in terms of this situation. Select the two correct answers. The median upload speed during peak hours is 5.905 megabits per second, which is less than the median upload speed during off-peak hours, 7.005 megabits per second. The upload speeds during peak hours are slower on average compared to off-peak times. The median upload speed during peak hours is 6.37 megabits per second, which is greater than the median upload speed during…arrow_forwardConsider the following data where "x" represents days starting on April 1,2020 and "y" is the number of cumulative deaths in Massachusetts attributed to Covid 19. 1.) Use the equation to predict the number of cumulative deaths as of June 14, 2020. Answer with a complete sentence "The predicted number of deaths by June 14 isarrow_forward
arrow_back_ios
SEE MORE QUESTIONS
arrow_forward_ios
Recommended textbooks for you
 Algebra: Structure And Method, Book 1AlgebraISBN:9780395977224Author:Richard G. Brown, Mary P. Dolciani, Robert H. Sorgenfrey, William L. ColePublisher:McDougal Littell
Algebra: Structure And Method, Book 1
Algebra
ISBN:9780395977224
Author:Richard G. Brown, Mary P. Dolciani, Robert H. Sorgenfrey, William L. Cole
Publisher:McDougal Littell
Hypothesis Testing using Confidence Interval Approach; Author: BUM2413 Applied Statistics UMP;https://www.youtube.com/watch?v=Hq1l3e9pLyY;License: Standard YouTube License, CC-BY
Hypothesis Testing - Difference of Two Means - Student's -Distribution & Normal Distribution; Author: The Organic Chemistry Tutor;https://www.youtube.com/watch?v=UcZwyzwWU7o;License: Standard Youtube License