Concept explainers
Videos
Take in a show: The following table presents the weekly attendance, in thousands, at Broadway shows during a recent season.
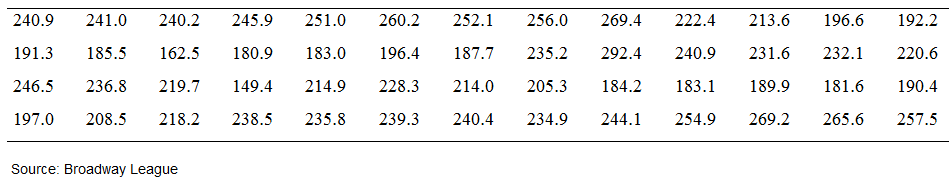
- Find the
mean and median weekly attendance. - Based on the mean and median, would you expect that a histogram would be skewed to the left, skewed to the right, or approximately symmetric? Explain.
- Construct a frequency histogram. Do the results agree with your expectation?
a)
To find mean weekly attendance
Answer to Problem 50E
Mean weekly attendance is 222.49
Explanation of Solution
Given:
| 149.4 | 196.4 | 231.6 | 244.1 |
| 162.5 | 196.6 | 232.1 | 245.9 |
| 180.9 | 197 | 234.9 | 246.5 |
| 181.6 | 205.3 | 235.2 | 251 |
| 183 | 208.5 | 235.8 | 252.1 |
| 183.1 | 213.6 | 236.8 | 254.9 |
| 184.2 | 214 | 238.5 | 256 |
| 185.5 | 214.9 | 239.3 | 257.5 |
| 187.7 | 218.2 | 240.2 | 260.2 |
| 189.9 | 219.7 | 240.4 | 265.6 |
| 190.4 | 220.6 | 240.9 | 269.2 |
| 191.3 | 222.4 | 240.9 | 269.4 |
| 192.2 | 228.3 | 241 | 292.4 |
Formula:
Calculation:
Here n = 52.
Values of Xi are weekly attendance.
Putting all values in formula,
Therefore, mean state income is 222.49
b)
To find median weekly attendance
Answer to Problem 50E
Median weekly attendance is 229.5
Explanation of Solution
Formula:
Calculation:
Sorted data in ascending order:
| 149.4 | 196.4 | 231.6 | 244.1 |
| 162.5 | 196.6 | 232.1 | 245.9 |
| 180.9 | 197 | 234.9 | 246.5 |
| 181.6 | 205.3 | 235.2 | 251 |
| 183 | 208.5 | 235.8 | 252.1 |
| 183.1 | 213.6 | 236.8 | 254.9 |
| 184.2 | 214 | 238.5 | 256 |
| 185.5 | 214.9 | 239.3 | 257.5 |
| 187.7 | 218.2 | 240.2 | 260.2 |
| 189.9 | 219.7 | 240.4 | 265.6 |
| 190.4 | 220.6 | 240.9 | 269.2 |
| 191.3 | 222.4 | 240.9 | 269.4 |
| 192.2 | 228.3 | 241 | 292.4 |
Here n = 52
Putting all values in formula,
Therefore, median weekly attendance is 229.95
c)
To find skewness of the data
Answer to Problem 50E
The data is left skewed
Explanation of Solution
Here,
Mean = 222.49
Median = 229.95
Therefore, the mean is smaller than the median, the data are skewed left
d)
To construct a frequency histogram
Answer to Problem 50E
The data is left skewed. Hence expectation meet
Explanation of Solution
Frequency histogram from given data:
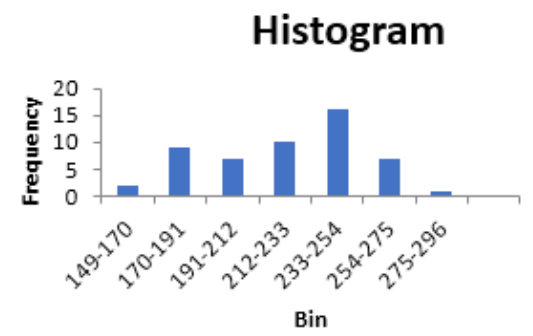
From frequency histogram, the tail of the data seems to be highly on left side. Therefore, shape of the distribution of data is left skewed. Hence expectation meet from frequency histogram
Want to see more full solutions like this?
Chapter 3 Solutions
ELEMENTARY STAT.(LL) >CUSTOM PACKAGE<


 Glencoe Algebra 1, Student Edition, 9780079039897...AlgebraISBN:9780079039897Author:CarterPublisher:McGraw Hill