
Videos
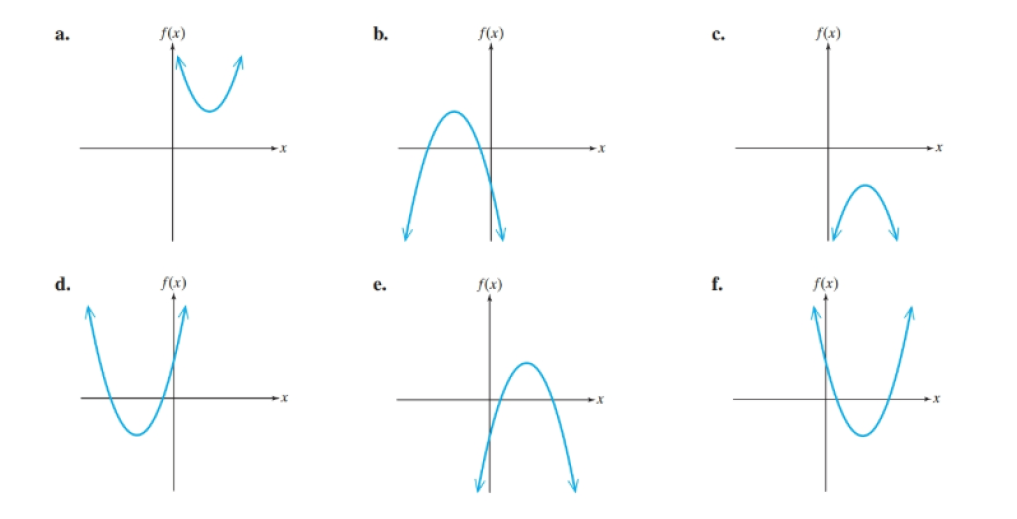
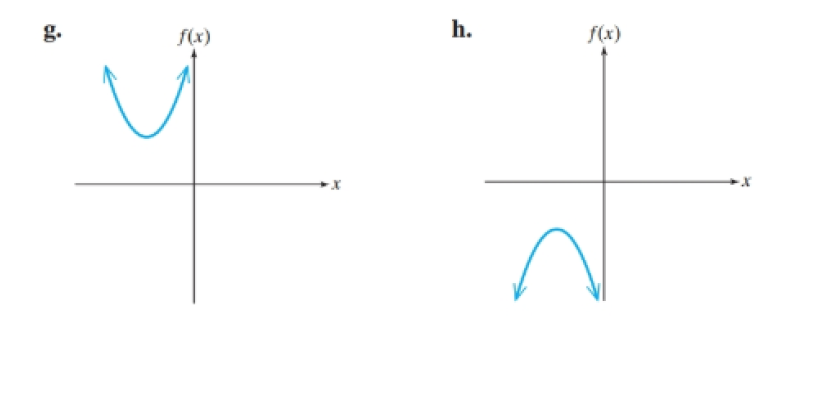
For Exercises 71–78, given a quadratic function defined by
Want to see the full answer?
Check out a sample textbook solution
Chapter 3 Solutions
College Algebra with Corequisite Support


- The Mauna Loa Observatory in Hawaii records the carbon dioxide concentration y (in parts per million) in Earth’s atmosphere. The January readings for various years are shown in Figure . In the July 1990 issue of Scientific American, these data were used to predict the carbon dioxide level in Earth’s atmosphere in the year 2035, using the quadratic model y = 0.018t2 + 0.70t + 316.2 (Quadratic model for 1960–1990 data) where t = 0 represents 1960, as shown in Figure a. The data shown in figure b represent the years 1980 through 2014 and can be modeled by y = 0.014t2 + 0.66t + 320.3 (Quadratic model for 1980–2014) data where t = 0 represents 1960. What was the prediction given in the Scientific American article in 1990? Given the second model for 1980 through 2014, does this prediction for the year 2035 seem accurate?arrow_forwardWrite a function for the blue graph of a quadratic function in a form: f(x) = a (b (x + c))2 + d (1, 1). (0,0) 2 (0, –1) (-1, –3)arrow_forwardIn Exercises 47–50, determine the x-intercepts of the graph of each quadratic function. Then match the function with its graph, labeled (a)-(d). Each graph is shown in a [-10, 10, 1] by [-10, 10, 1] viewing rectangle. 47. у 3D х2 -бх + 8 48. y = x? – 2r – 8 49. y = x² + 6x + 8 50. y = x² + 2x – 8 а. b. C. d.arrow_forward
- For Exercises 111–114, use the relationship given in the right triangle and the inverse sine, cosine, and tangent functions to write θ as a function of x in three different ways. It is not necessary to rationalize the denominator.arrow_forwardFind the quadratic function y = ax +bx+c whose graph passes through the given points %3D (-2,8), (1, – 4), (3,8) y =arrow_forwardThe graph of a quadratic function f passes through the points (−2, 4), (1, 1) and (5, 0). What is the y-intercept of the graph of f?arrow_forward
- Find expressions for the quadratic functions whose graphs are shown y (-2, 2), (0, 1) (4, 2) 3 (1,–2.5)arrow_forwardfind the vertex for f (x) = x² – 6x + 13.arrow_forwardFind a quadratic function that fits the set of data points. (0, – 2), (5,28), (25,48) f(x) = (Use integers or fractions for any numbers in the equaticarrow_forward
- The following table shows the crude steel production in the USA, in millions of metric tons. Year Crude Steel Production 1980 0 1985 5 1989 9 80 90 92 (A) Find a quadratic function f(x) = ax²+bx+c that fits the data, where x represents the number of years after 1980. f(x)= x² +2.833x + 80.arrow_forwardFind the quadratic function satisfying the given conditions. The vertex is (6, –3), and one x-intercept is 4.arrow_forwardb. Find a quadratic function that models y, the number of millions of people with Alzheimer's disease or other dementia, as a function of x, the number of years after 2000. Report the model with four significant digits. y = (x² + (x + (Type integers or decimals.)arrow_forward
 Algebra & Trigonometry with Analytic GeometryAlgebraISBN:9781133382119Author:SwokowskiPublisher:Cengage