MindTap Business Statistics with XLSTAT, 1 term (6 months) Printed Access Card for Anderson/Sweeney/Williams/Camm/Cochran's Modern Business Statistics ... Office Excel, 6th (MindTap Course List)
6th Edition
ISBN: 9781337556729
Author: David R. Anderson, Dennis J. Sweeney, Thomas A. Williams, Jeffrey D. Camm, James J. Cochran
Publisher: Cengage Learning
bartleby

Concept explainers

bartleby

Videos

Textbook Question
Book Icon
Chapter 3.1, Problem 8E

Middle-Level Manager Salaries. Suppose that an independent study of middle-level managers employed at companies located in Atlanta, Georgia, was conducted to compare the salaries of managers working at firms in Atlanta to the salaries of middle-level managers across the nation. The following data show the salary, in thousands of dollars, for a sample of 15 middle-level managers employed at companies in the Atlanta area.

Chapter 3.1, Problem 8E, Middle-Level Manager Salaries. Suppose that an independent study of middle-level managers employed

  1. a. Compute the median salary for the sample of 15 middle-level managers. Suppose the median salary of middle-level managers employed at companies located across the nation is $85,000. How does the median salary for middle-level managers in the Atlanta area compare to the median for managers across the nation?
  2. b. Compute the mean annual salary for managers in the Atlanta area and discuss how and why it differs from the median computed in part (a) for Atlanta area managers.
  3. c. Compute the first and third quartiles for the salaries of middle-level managers in the Atlanta area.

a.

Expert Solution
Check Mark
To determine

Find the median salary for the sample of 15 middle-level managers.

Compare the median obtained median with the median reported by Wall Street Journal.

Answer to Problem 8E

The median salary for the sample of 15 middle- level managers is $80,000.

Explanation of Solution

Calculation:

The data set represent the salary (in thousand dollars) for a sample of 15 middle-level managers.

Software Procedure:

Step by step procedure to obtain the descriptive statistics using EXCEL is as follows:

  • In an EXCEL sheet enter 15 salaries and label it as Salary.
  • Go to Data > Data Analysis (in case it is not default, take the Analysis ToolPak from Excel Add Ins) > Descriptive statistics.
  • Enter Input Range as $A$2:$A$15, select Columns in Grouped By, tick on Summary statistics.
  • Click on OK.

Output using EXCEL is given as follows:

MindTap Business Statistics with XLSTAT, 1 term (6 months) Printed Access Card for Anderson/Sweeney/Williams/Camm/Cochran's Modern Business Statistics ... Office Excel, 6th (MindTap Course List), Chapter 3.1, Problem 8E

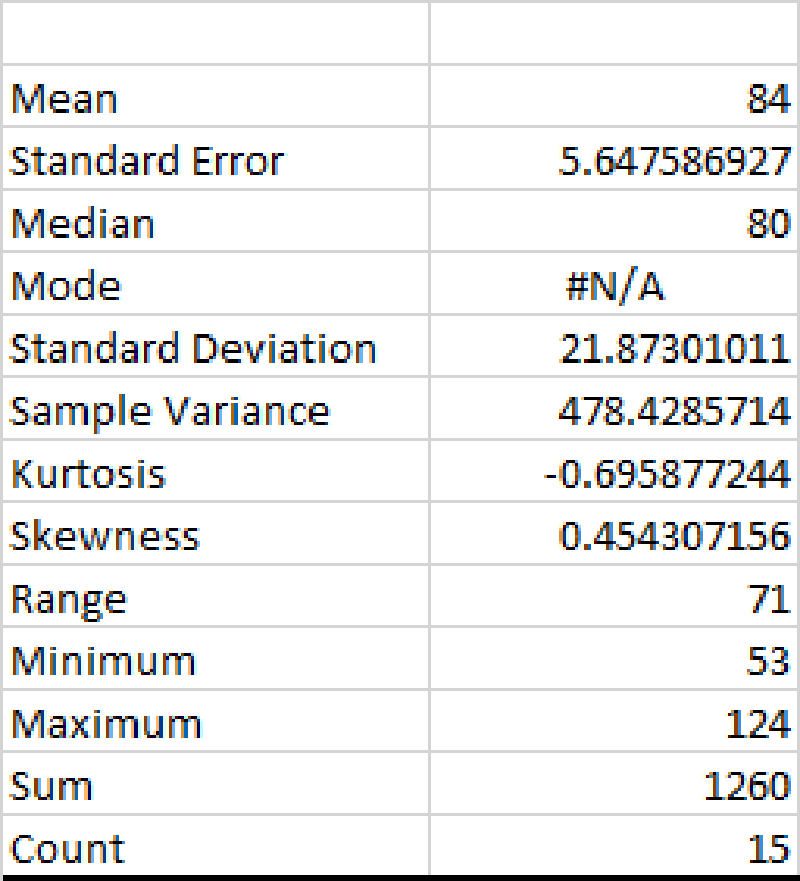
From the EXCEL output, the median salary is 80.

Since, the salary is given in thousand dollars, the median salary for a sample of 15 level managers can be inferred as $80,000.

The Wall Street Journal reported that the median salary for middle-level manager jobs is approximately $85,000.

Here, $80,000 < $85,000.

Therefore, the median salary for the sample of 15 middle-level managers working at firms in City A is slightly lower than the median salary reported by the Wall Street Journal.

b.

Expert Solution
Check Mark
To determine

Find the mean annual salary.

Explain the reason behind the existence of difference between computed mean and median in part (a).

Answer to Problem 8E

The mean annual salary is $84,000.

The distribution of salaries for middle-level managers working at firms in City A is right skewed.

Explanation of Solution

From the excel output, it is clear that the mean annual salary is 84.

Here, the median salary is less than the mean salary for the sample of 15 middle- level managers.

Skewness:

In statistics, skewness is a measure by which anyone can measure the asymmetrical behaviour of a distribution.

A distribution is said to be symmetric, when its mean, median, and mode are the same. In other words it can be said that, the length of the curve of the left-hand tail will be a mirror image of the right-hand tail.

Therefore, the shape of a distribution can be identified by using the measure of skewness.

Left-skewed:

For a left-skewed distribution, Mean<Median<Mode. Moreover, the data will monotonically decrease after attaining the maximum and if the left hand side of the curve is larger than the right hand side, then it is called a left-skewed distribution. This is also called as negatively-skewed distribution.

Right-skewed:

For a right-skewed distribution, Mean > Median > Mode. Moreover, the data will monotonically increase after attaining the maximum and if the right hand side of the curve is larger than the left hand side, then it is called a right-skewed distribution. This is also called as positively-skewed distribution.

Since, mean is greater than median, it can be inferred that the distribution of annual salary is right or positive skewed.

d.

Expert Solution
Check Mark
To determine

Obtain the first and third quartiles of the dataset.

Answer to Problem 8E

The first and third quartiles of the dataset are Q1=67_, and Q3=106_, respectively.

Explanation of Solution

Calculation:

Quartiles:

Quartiles are those values which divide the data into four equal parts.

Quartiles tells that 25% of the values will be less than the first quartile and 25% of the values will be greater than the third quartile and 50% of the values lies between the first and third quartile with median dividing the parts.

The general formula to obtain the location of pth percentile is given below:

Lp=p100(n+1)

First quartile:

The first quartile Q1 of a dataset is a value that divides the lowest 25% of the observations and highest 75% percent of observations.

Therefore, the first quartile is the 25th percentile.

The location of 25th percentile is calculated as follows:

L25=25100(15+1)=25(16)100=400100=4

Thus, the location of 25th percentile is 4.0.

From this it can be said that, the 25th percentile is 0% of the way between the value in 4th position of ordered dataset and the value in 5th position of ordered dataset.

The dataset of annual salary have to be arranged in ascending order.

The values corresponding to 4th and 5th positions of ordered dataset of annual salaries are 67 and 73.

The 25th percentile is the value in 4th position (67) plus 0.0 times the difference between the value in 4th position and 5th position.

The 25th percentile is obtained as given below:

25thpercentile=67+0.0(7367)=67

Hence, the 25th percentile or first quartile is 67.

Third quartile:

The third quartile Q3 of a dataset is a value that divides the lowest 75% of the observations and highest 25% percent of observations.

Therefore, the third quartile is the 75th percentile.

The location of 75th percentile is calculated as follows:

L75=75100(15+1)=75(16)100=1,200100=12

Thus, the location of 75th percentile is 12.

From this it can be said that, the 75th percentile is 0% of the way between the value in 12th position of ordered dataset and the value in 13th position of ordered dataset.

The dataset of annual salary have to be arranged in ascending order.

The values corresponding to 12th and 13th positions of ordered dataset of annual salaries are 106 and 108.

The 75th percentile is the value in 12th position (106) plus 0.0 times the difference between the value in 12th position and 13th position.

The 75th percentile is obtained as given below:

75thpercentile=106+0.0(108106)=106

Hence, the 75th percentile or third quartile is 106.

Thus, the first and third quartiles of the dataset are Q1=67_, and Q3=106_, respectively.

Want to see more full solutions like this?

Subscribe now to access step-by-step solutions to millions of textbook problems written by subject matter experts!

Chapter 3 Solutions

MindTap Business Statistics with XLSTAT, 1 term (6 months) Printed Access Card for Anderson/Sweeney/Williams/Camm/Cochran's Modern Business Statistics ... Office Excel, 6th (MindTap Course List)

Ch. 3.1 - Prob. 11ECh. 3.1 - The Big Bang Theory, a situation comedy...Ch. 3.1 - Automobile Fuel Efficiencies. In automobile...Ch. 3.1 - The data contained in the DATAfile named...Ch. 3.1 - 15. Martinez Auto Supplies has retail stores...Ch. 3.1 - 16. The grade point average for college students...Ch. 3.1 - 17. The following table shows the total return and...Ch. 3.1 - 18. Based on a survey of master’s programs in...Ch. 3.1 - Annual revenue for Corning Supplies grew by 5.5%...Ch. 3.1 - Suppose that at the beginning of Year 1 you...Ch. 3.1 - Prob. 21ECh. 3.1 - Prob. 22ECh. 3.2 - 23. Consider a sample with data values of 10, 20,...Ch. 3.2 - Prob. 24ECh. 3.2 - Consider a sample with data values of 27, 25, 20,...Ch. 3.2 - Price of Unleaded Gasoline. Data collected by the...Ch. 3.2 - Round-Trip Flight Prices. The following table...Ch. 3.2 - The Australian Open is the first of the four...Ch. 3.2 - Air Quality Index. The Los Angeles Times regularly...Ch. 3.2 - Prob. 30ECh. 3.2 - The results of Accounting Principals’ latest...Ch. 3.2 - Advertising Spend by Companies. Advertising Age...Ch. 3.2 - Scores turned in by an amateur golfer at the...Ch. 3.2 - Consistency of Running Times. The following times...Ch. 3.3 - 35. Consider a sample with data values of 10, 20,...Ch. 3.3 - 36. Consider a sample with a mean of 500 and a...Ch. 3.3 - 37. Consider a sample with a mean of 30 and a...Ch. 3.3 - 38. Suppose the data have a bell-shaped...Ch. 3.3 - 39. The results of a national survey showed that...Ch. 3.3 - 40. The energy information Administration reported...Ch. 3.3 - 41. The Graduate Management Admission Test (GMAT)...Ch. 3.3 - 42. Many families in California are using backyard...Ch. 3.3 - According to a Los Angeles Times study of more...Ch. 3.3 - NCAA Basketball Game Scores. A sample of 10 NCAA...Ch. 3.3 - The Wall Street Journal reported that Walmart...Ch. 3.4 - Consider a sample with data values of 27, 25, 20,...Ch. 3.4 - Prob. 47ECh. 3.4 - Prob. 48ECh. 3.4 - Prob. 49ECh. 3.4 - Naples Half-Marathon Times. Naples, Florida, hosts...Ch. 3.4 - Pharmaceutical Company Sales. Annual sales, in...Ch. 3.4 - Cell Phone Companies Customer Satisfaction....Ch. 3.4 - Most Admired Companies. Fortune magazine’s list of...Ch. 3.4 - Prob. 54ECh. 3.5 - Five observations taken for two variables...Ch. 3.5 - Prob. 56ECh. 3.5 - The DATAfile TwoStocks contains adjusted monthly...Ch. 3.5 - Driving Speed and Fuel Efficiency. A department of...Ch. 3.5 - Smoke Detector Use and Death Rates. Over the past...Ch. 3.5 - Stock Market Indexes Comparison. The Russell 1000...Ch. 3.5 - Best Private Colleges. A random sample of 30...Ch. 3 - Americans Dining Out. Americans tend to dine out...Ch. 3 - NCAA Football Coaches Salaries. A 2017 USA Today...Ch. 3 - Physician Office Waiting Times. The average...Ch. 3 - Worker Productivity and Insomnia. U.S. companies...Ch. 3 - A study of smartphone users shows that 68% of...Ch. 3 - Work Commuting Methods. Public transportation and...Ch. 3 - Household Incomes. The following data represent a...Ch. 3 - Restaurant Chains’ Sales per Store. The data...Ch. 3 - Prob. 70SECh. 3 - NFL Teams Worth. In 2014, the 32 teams in the...Ch. 3 - MLB Team Winning Percentages. Does a major league...Ch. 3 - 73. The days to maturity for a sample of five...Ch. 3 - 74. Automobiles traveling on a road with a posted...Ch. 3 - Annual Returns for Panama Railroad Company Stock....Ch. 3 - Pelican Stores, a division of National Clothing,...Ch. 3 - The motion picture industry is a competitive...Ch. 3 - The pursuit of a higher education degree in...Ch. 3 - Although millions of elephants once roamed across...
Knowledge Booster
Background pattern image
Statistics
Learn more about
Need a deep-dive on the concept behind this application? Look no further. Learn more about this topic, statistics and related others by exploring similar questions and additional content below.
Recommended textbooks for you
Text book image
Glencoe Algebra 1, Student Edition, 9780079039897...
Algebra
ISBN:9780079039897
Author:Carter
Publisher:McGraw Hill
Statistics 4.1 Point Estimators; Author: Dr. Jack L. Jackson II;https://www.youtube.com/watch?v=2MrI0J8XCEE;License: Standard YouTube License, CC-BY
Statistics 101: Point Estimators; Author: Brandon Foltz;https://www.youtube.com/watch?v=4v41z3HwLaM;License: Standard YouTube License, CC-BY
Central limit theorem; Author: 365 Data Science;https://www.youtube.com/watch?v=b5xQmk9veZ4;License: Standard YouTube License, CC-BY
Point Estimate Definition & Example; Author: Prof. Essa;https://www.youtube.com/watch?v=OTVwtvQmSn0;License: Standard Youtube License
Point Estimation; Author: Vamsidhar Ambatipudi;https://www.youtube.com/watch?v=flqhlM2bZWc;License: Standard Youtube License