
Videos
a.
Find the mean back-to-school expenditure for each group.
Check whether the data is consistent with the NRF report.
a.
Answer to Problem 32E
The mean back-to-school expenditure for freshmen is $1,285.
The mean back-to-school expenditure for seniors is $433.
The data is consistent with the NRF report.
Explanation of Solution
Calculation:
The data represents the back-to-school expenditure for a sample of 25 freshmen and 20 seniors. It was found that college freshman spend more on back-to-school items than any other college group.
Freshmen:
Software procedure:
Step-by-step procedure to obtain the
- In an EXCEL sheet enter the values of first sample and label it as Freshmen.
- Go to Data > Data Analysis (in case it is not default, take the Analysis ToolPak from Excel Add Ins) > Descriptive statistics.
- Enter Input
Range as $A$2:$A$26, select Columns in Grouped By, tick on Summary statistics. - Click Enter.
Output using EXCEL is given as follows:
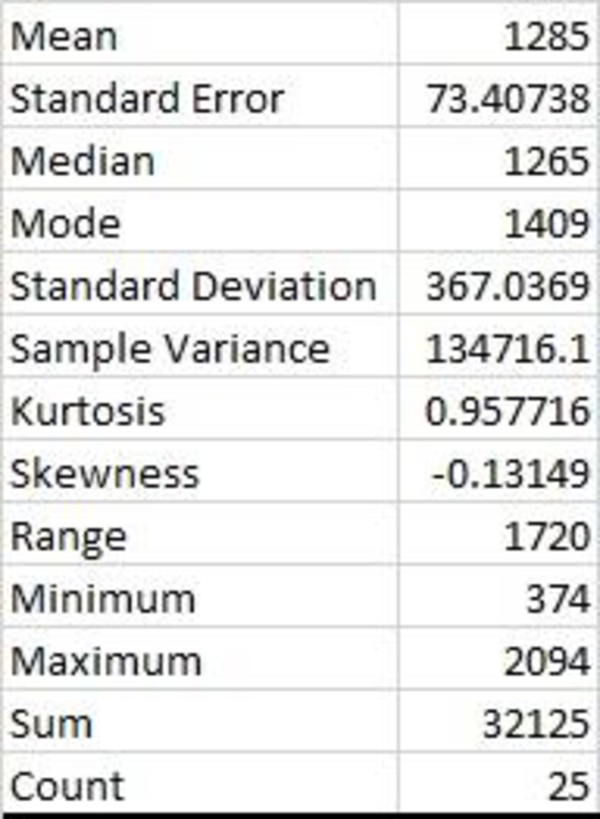
From the EXCEL output, mean is 1,285.
Thus, the mean back-to-school expenditure for freshmen is $1,285.
Seniors:
Software procedure:
Step-by-step procedure to obtain the descriptive statistics using EXCEL is as follows:
- In an EXCEL sheet enter the values of second sample and label it as Seniors.
- Go to Data > Data Analysis (in case it is not default, take the Analysis ToolPak from Excel Add Ins) > Descriptive statistics.
- Enter Input Range as $C$2:$C$21, select Columns in Grouped By, tick on Summary statistics.
- Click Enter.
Output using EXCEL is given as follows:
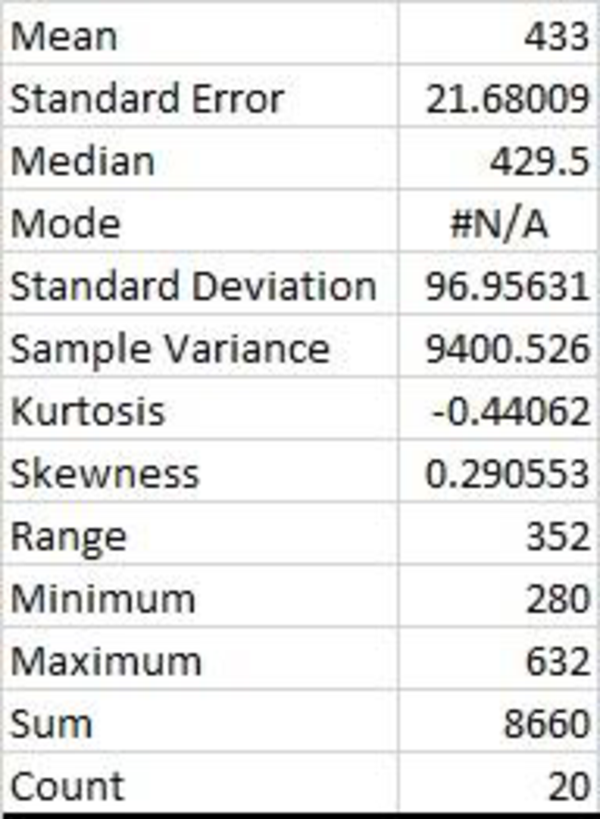
From the EXCEL output, mean is 433.
Thus, the mean back-to-school expenditure for seniors is $433.
The mean back-to-school expenditure for freshmen is more than seniors.
Therefore, the data is consistent with the NRF report.
b.
Find the range for the expenditures in each group.
b.
Answer to Problem 32E
The range for back-to-school expenditure for freshmen is 1,720.
The range for back-to-school expenditure for seniors is 352.
Explanation of Solution
Calculation:
From the EXCEL output obtained in Part (a), the range of back-to-school expenditure for freshmen is 1,720 and the range of back-to-school expenditure for seniors is 352.
Thus, the range of back-to-school expenditure for freshmen and seniors are 1,720 and 352, respectively.
d.
Calculate the
d.
Answer to Problem 32E
The inter quartile range for freshmen is 456.
The inter quartile range for seniors is 139.25.
Explanation of Solution
Freshmen:
The first and third quartiles are obtained back-to-school expenditure for freshmen.
First quartile:
The EXCEL
Software Procedure:
Step-by-step procedure to obtain the first quartile using EXCEL is as follows:
- In an EXCEL sheet enter the values of first sample and label it as Automotive.
- In a cell enter the formula QUARTILE.EXC ($I$2:$I$26,1).
- Click Enter.
Output using EXCEL is given as follows:
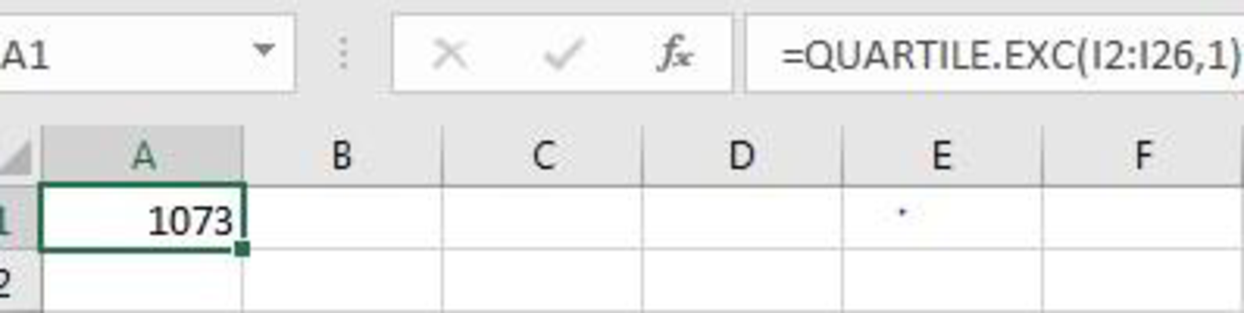
From the EXCEL output, the first quartile of the sample data is 1,073.
Third quartile:
The EXCEL function to compute third quartile is
Software Procedure:
Step-by-step procedure to obtain the third quartile using EXCEL is as follows:
- In an EXCEL sheet enter the values of first sample and label it as Automotive.
- In a cell enter the formula QUARTILE.EXC ($I$2:$I$26,1).
- Click Enter.
Output using EXCEL is given as follows:
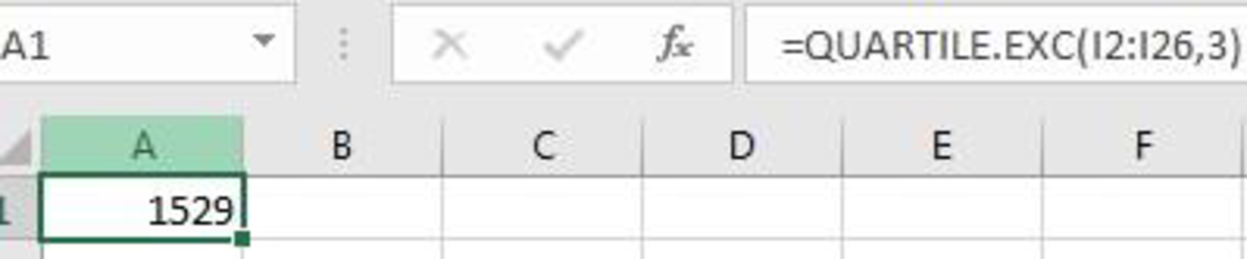
From the EXCEL output, the third quartile of the sample data is 1,529.
The first quartile and third quartile of the sample data are 1,073 and 1,529, respectively.
Inter quartile range:
The first quartile is
The inter quartile range is obtained as given below:
Thus, the inter quartile range for freshmen is 456.
Seniors:
The first and third quartiles are obtained for the annual advertising expenditures in the department store sector.
First quartile:
The EXCEL function to compute first quartile is
Software Procedure:
Step-by-step procedure to obtain the first quartile using EXCEL is as follows:
- In an EXCEL sheet enter the values of second sample and label it as Department store.
- In a cell enter the formula QUARTILE.EXC ($J$2:$J$21,1).
- Click Enter.
Output using EXCEL is given as follows:
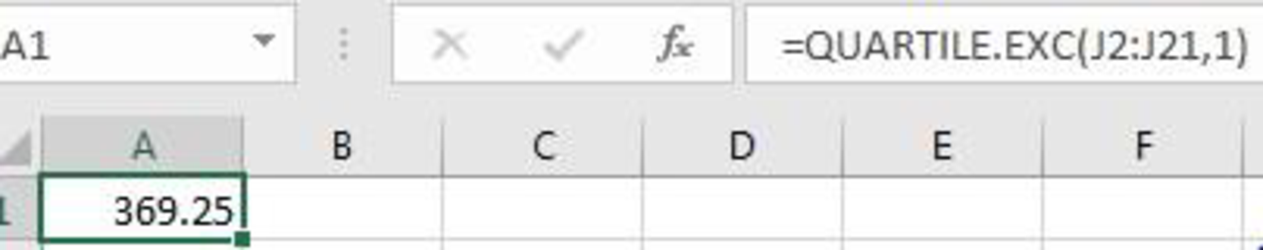
From the EXCEL output, the first quartile of the sample data is 369.25.
Third quartile:
The EXCEL function to compute third quartile is
Software Procedure:
Step-by-step procedure to obtain the third quartile using EXCEL is as follows:
- In an EXCEL sheet enter the values of second sample and label it as Department store.
- In a cell enter the formula QUARTILE.EXC ($J$2:$J$21,3).
- Click Enter.
Output using EXCEL is given as follows:
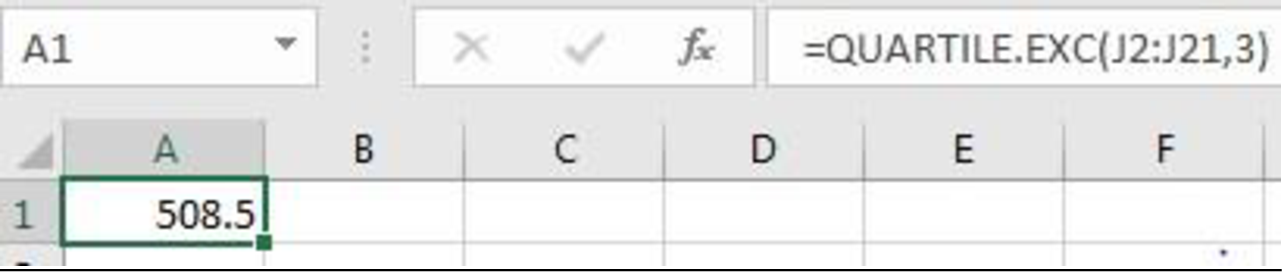
From the EXCEL output, the third quartile of the sample data is 508.5.
The first quartile and third quartile of the sample data are 369.25 and 508.5, respectively.
Inter quartile range:
The first quartile is
The inter quartile range is obtained as given below:
Thus, the inter quartile range for seniors is 139.25.
Thus, the interquartile range for freshmen and seniors are 456 and 139.25, respectively.
d.
Find the standard deviation for the expenditures in each group.
d.
Answer to Problem 32E
The standard deviation for back-to-school expenditure for freshmen is 367.04.
The standard deviation for back-to-school expenditure for seniors is 96.96.
Explanation of Solution
Calculation:
From the EXCEL output obtained in Part (a), the standard deviation for freshmen is 367.04 and the standard deviation for seniors is 96.96.
Thus, the standard deviation for back-to-school expenditure for freshmen and seniors are 367.04 and 96.96, respectively.
e.
Check whether freshmen or seniors have more variation in back-to-school expenditures.
e.
Explanation of Solution
From the above parts, it can be observed that the all the measures of variabilities are more for freshmen than seniors.
Thus, freshmen have more variation in back-to-school expenditures
Want to see more full solutions like this?
Chapter 3 Solutions
Modern Business Statistics with Microsoft Excel (MindTap Course List)


 Glencoe Algebra 1, Student Edition, 9780079039897...AlgebraISBN:9780079039897Author:CarterPublisher:McGraw Hill
 Big Ideas Math A Bridge To Success Algebra 1: Stu...AlgebraISBN:9781680331141Author:HOUGHTON MIFFLIN HARCOURTPublisher:Houghton Mifflin Harcourt