Elementary Statistics ( 3rd International Edition ) Isbn:9781260092561
3rd Edition
ISBN: 9781259969454
Author: William Navidi Prof.; Barry Monk Professor
Publisher: McGraw-Hill Education
bartleby

Concept explainers

bartleby

Videos

Textbook Question
Book Icon
Chapter 3.2, Problem 40E

House prices: The following table presents prices, in thousands of dollars, of single-family homes for some of the largest metropolitan areas in the United States for the third quarter of 2015 and the third quarter of 20l6.

Chapter 3.2, Problem 40E, House prices: The following table presents prices, in thousands of dollars, of single-family homes

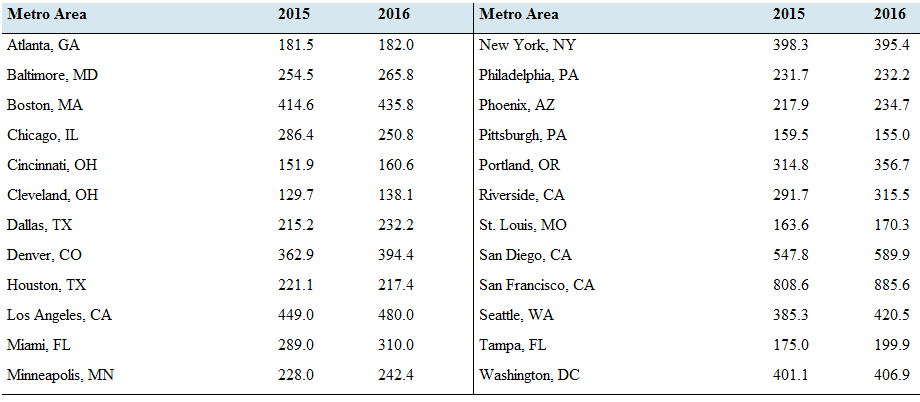
  1. Find the population standard deviation for 2015.
  2. Find the population standard deviation for 2016.
  3. In general, house prices increased from 2015 to 2016. Did the spread in house prices increase as well, or did it decrease?

a)

Expert Solution
Check Mark
To determine

To find the Population standard deviation for 2015.

Answer to Problem 40E

Standard Deviation = 149.71

Explanation of Solution

Given:

The data

    Metro Area20152016Metro Area20152016
    Atlanta, GA181.5182New York, NY398.3395.4
    Baltimore, MD254.5265.8Philadelphia, PA231.7232.2
    Boston, MA414.6435.8Phoenix, AZ217.9234.7
    Chicago, IL286.4250.8Pittsburgh, PA159.5155
    Cincinnati, OH151.9160.6Portland, OR314.8356.7
    Cleveland, OH129.7138.1Riverside, CA291.7315.5
    Dallas, TX215.2232.2St. Louis, MO163.6170.3
    Denver, CO362.9394.4San Diego, CA547.8589.9
    Houston, TX221.1217.4San Francisco, CA808.6885.6
    Los Angeles, CA449480Seattle, WA385.3420.5
    Miami, FL289310Tampa, FL175199.9
    Minneapolis, MN228242.4Washington, DC401.1406.9

Calculation:

    Metro Area2015 (x)(xix¯)2
    Atlanta, GA181.514834.23
    Baltimore, MD254.52381.03
    Boston, MA414.612388.62
    Chicago, IL286.4285.47
    Cincinnati, OH151.922920.70
    Cleveland, OH129.730135.51
    Dallas, TX215.27760.88
    Denver, CO362.93552.66
    Houston, TX221.16756.16
    Los Angeles, CA44921229.70
    Miami, FL289204.37
    Minneapolis, MN2285669.46
    New York, NY398.39025.79
    Philadelphia, PA231.75125.96
    Phoenix, AZ217.97292.45
    Pittsburgh, PA159.520677.24
    Portland, OR314.8132.35
    Riverside, CA291.7134.46
    St. Louis, MO163.619514.93
    San Diego, CA547.859782.29
    San Francisco, CA808.6255332.30
    Seattle, WA385.36724.68
    Tampa, FL17516459.82
    Washington, DC401.19565.66
    SUM7279.1537886.71
    Mean 303.296 
    Standard deviation149.71 

  Mean = xin=7279.124=303.296

  Standard Deviation =  ( x i x ¯ ) 2 n= 537886.71 24=149.71

The mean and standard deviation for2015 is 303.296 and 149.71.

b)

Expert Solution
Check Mark
To determine

To find the Population standard deviation for 2016.

Answer to Problem 40E

Standard Deviation = 164.65

Explanation of Solution

Calculation:

    Metro Area2016(xix¯)2
    Atlanta, GA18218953.26
    Baltimore, MD265.82902.07
    Boston, MA435.813485.98
    Chicago, IL250.84743.19
    Cincinnati, OH160.625303.53
    Cleveland, OH138.132967.97
    Dallas, TX232.27651.15
    Denver, CO394.45584.45
    Houston, TX217.410459.32
    Los Angeles, CA48025705.44
    Miami, FL31093.53
    Minneapolis, MN242.45970.78
    New York, NY395.45734.91
    Philadelphia, PA232.27651.15
    Phoenix, AZ234.77220.04
    Pittsburgh, PA15527116.48
    Portland, OR356.71371.16
    Riverside, CA315.517.40
    St. Louis, MO170.322311.65
    San Diego, CA589.973023.80
    San Francisco, CA885.6320275.82
    Seattle, WA420.510166.52
    Tampa, FL199.914345.05
    Washington, DC406.97608.93
    SUM7672.1650663.57
    Mean 319.67 
    Standard deviation164.65 

  Mean = xin=7672.124=319.67

  Standard Deviation =  ( x i x ¯ ) 2 n= 650663.57 24=164.65

The mean and standard deviation of sports model is 319.67 and 164.65.

c)

Expert Solution
Check Mark
To determine

To explain whether the house prices has increased from 2015 to 2016 or not and also explain the spread from 2015 to 2016.

Answer to Problem 40E

Yes, House price and spread has increasedfrom 2015 to 2016.

Explanation of Solution

Mean house price in 2015 was 303.296 and in 2016 it was 319.67 which shows that house prices has increased from 2015 to 2016 and also the spread has increased from 149.71 to 164.65.

Want to see more full solutions like this?

Subscribe now to access step-by-step solutions to millions of textbook problems written by subject matter experts!

Chapter 3 Solutions

Elementary Statistics ( 3rd International Edition ) Isbn:9781260092561

Ch. 3.1 - Find the mean, median, and mode for the following...Ch. 3.1 - Find the mean, median, and mode for the following...Ch. 3.1 - In Exercises 21—24, use the given frequency...Ch. 3.1 - In Exercises 21—24, use the given frequency...Ch. 3.1 - In Exercises 21—24, use the given frequency...Ch. 3.1 - In Exercises 21—24, use the given frequency...Ch. 3.1 - Use the properties of the mean and median to...Ch. 3.1 - Use the properties of the mean and median to...Ch. 3.1 - Use the properties of the mean and median to...Ch. 3.1 - Use the properties of the mean and median to...Ch. 3.1 - Find the mean, median, and mode of the data in the...Ch. 3.1 - Find the mean, median, and mode of the data in the...Ch. 3.1 - Facebook friends: In a study of Facebook users...Ch. 3.1 - Mean and median height: The National Center for...Ch. 3.1 - Life expectancy: According to the National Vital...Ch. 3.1 - Prob. 34ECh. 3.1 - Hamburgers: An ABC News story reported the number...Ch. 3.1 - Great swimmer: In the 2016 Olympic Games, Michael...Ch. 3.1 - Mobile apps: The following table presents the...Ch. 3.1 - Prob. 38ECh. 3.1 - Whats your favorite TV show? The following tables...Ch. 3.1 - Prob. 40ECh. 3.1 - Gas prices: The following table presents the...Ch. 3.1 - Prob. 42ECh. 3.1 - Heavy football players: Following are the weights,...Ch. 3.1 - Prob. 44ECh. 3.1 - Flu season: The following tables present the...Ch. 3.1 - News flash: The following table presents the...Ch. 3.1 - Commercial break: Following are the amounts spent...Ch. 3.1 - Prob. 48ECh. 3.1 - Dont drink and drive: The Insurance Institute for...Ch. 3.1 - Prob. 50ECh. 3.1 - Be my Valentine: The following frequency...Ch. 3.1 - Get your degree: The following frequency...Ch. 3.1 - Prob. 53ECh. 3.1 - Take in a show: The following table presents the...Ch. 3.1 - Prob. 55ECh. 3.1 - Sources of news: A sample of 32 U.S. adults was...Ch. 3.1 - Find the mean: The National Center for Health...Ch. 3.1 - Find the median: According to a recent Current...Ch. 3.1 - Find the median: In a recent year, approximately...Ch. 3.1 - Find the median: The National Health and Nutrition...Ch. 3.1 - Heights: There are 2500 women and 2000 men...Ch. 3.1 - Prob. 62ECh. 3.1 - Heights: There are 35 students in a class. Fifteen...Ch. 3.1 - Prob. 64ECh. 3.1 - Prob. 65ECh. 3.1 - Prob. 66ECh. 3.1 - Whats the score? Jermaine has entered a bowling...Ch. 3.1 - Whats your grade? Addison has been told that her...Ch. 3.1 - Weighted mean: Rachel worked at three part-time...Ch. 3.1 - Weighted mean: In Jacobs statistics class, the...Ch. 3.1 - Mean or median? The Smith family in Example 3.5...Ch. 3.1 - Prob. 72ECh. 3.1 - Prob. 73ECh. 3.1 - Prob. 74ECh. 3.1 - Prob. 75ECh. 3.1 - Prob. 76ECh. 3.1 - Prob. 77ECh. 3.1 - Prob. 78ECh. 3.1 - Prob. 79ECh. 3.1 - Prob. 80ECh. 3.1 - Prob. 81ECh. 3.1 - Prob. 82ECh. 3.2 - In Exercises 11—14, fill in each blank with the...Ch. 3.2 - In Exercises 11—14, fill in each blank with the...Ch. 3.2 - In Exercises 11—14, fill in each blank with the...Ch. 3.2 - In Exercises 11—14, fill in each blank with the...Ch. 3.2 - In Exercises 15—18, determine whether the...Ch. 3.2 - In Exercises 15—18, determine whether the...Ch. 3.2 - In Exercises 15—18, determine whether the...Ch. 3.2 - In Exercises 15—18, determine whether the...Ch. 3.2 - Find the sample variance and standard deviation...Ch. 3.2 - Find the sample variance and standard deviation...Ch. 3.2 - Find the sample variance and standard deviation...Ch. 3.2 - Find the population variance and standard...Ch. 3.2 - Find the population variance and standard...Ch. 3.2 - Find the population variance and standard...Ch. 3.2 - Approximate the sample variance and standard...Ch. 3.2 - Approximate the sample variance and standard...Ch. 3.2 - Approximate the population variance and standard...Ch. 3.2 - Approximate the population variance and standard...Ch. 3.2 - Distances of the eight planets from the sun, in...Ch. 3.2 - A survey was taken in which people were asked how...Ch. 3.2 - The following TI-84 Plus display presents some...Ch. 3.2 - The following TI-84 Plus display presents some...Ch. 3.2 - The following TI-84 Plus display presents some...Ch. 3.2 - The following TI-84 Plus display presents some...Ch. 3.2 - Amazon: The following table presents the retail...Ch. 3.2 - Sports car or convertible? The following table...Ch. 3.2 - Heavy football players: Following are the weights,...Ch. 3.2 - Beer: The following table presents the number of...Ch. 3.2 - Whats your favorite TV show? The following tables...Ch. 3.2 - House prices: The following table presents prices,...Ch. 3.2 - Stock prices: Following are the closing prices of...Ch. 3.2 - Prob. 42ECh. 3.2 - Time to review: The following table presents the...Ch. 3.2 - Age distribution: The ages of residents of Banks...Ch. 3.2 - Lunch break: In a recent survey of 655 working...Ch. 3.2 - Pay your bills: In a large sample of customer...Ch. 3.2 - Newborn babies: A study conducted by the Center...Ch. 3.2 - Internet providers: In a survey of 600 homeowners...Ch. 3.2 - Lunch break: For the data in Exercise 45, estimate...Ch. 3.2 - Pay your bills: For the data in Exercise 46,...Ch. 3.2 - Newborn babies: For the data in Exercise 47,...Ch. 3.2 - Internet providers: For the data in Exercise 48,...Ch. 3.2 - Prob. 53ECh. 3.2 - Empirical Rule OK? The following histogram...Ch. 3.2 - Empirical Rule OK? The following histogram...Ch. 3.2 - Empirical Rule OK? The following histogram...Ch. 3.2 - Whats the temperature? The temperature in a...Ch. 3.2 - Find the standard deviation: The National Center...Ch. 3.2 - Find the standard deviation: The National Center...Ch. 3.2 - Price of electricity: The Energy Information...Ch. 3.2 - Possible or impossible? A data set has a mean of...Ch. 3.2 - Possible or impossible? A data set has a mean of...Ch. 3.2 - Prob. 63ECh. 3.2 - Prob. 64ECh. 3.2 - Height and weight: A Naona1 Center for Health...Ch. 3.2 - Test scores: Scores on a statistics exam had a...Ch. 3.2 - Mean absolute deviation: A measure of spread that...Ch. 3.2 - Prob. 68ECh. 3.3 - In Exercises 9—12, fill in each blank with the...Ch. 3.3 - In Exercises 9—12, fill in each blank with the...Ch. 3.3 - In Exercises 9—12, fill in each blank with the...Ch. 3.3 - In Exercises 9—12, fill in each blank with the...Ch. 3.3 - In Exercises 13—16, determine whether the...Ch. 3.3 - In Exercises 13—16, determine whether the...Ch. 3.3 - In Exercises 13—16, determine whether the...Ch. 3.3 - In Exercises 13—16, determine whether the...Ch. 3.3 - A popu1aon has mean =7 and standard deviation =2....Ch. 3.3 - A population has mean =25 and standard deviation...Ch. 3.3 - In Exercises 19 and 20, identify the outlier. Then...Ch. 3.3 - Prob. 20ECh. 3.3 - For the data set 37 82 20 25 31 10 41 44 4 36 68...Ch. 3.3 - For the data set Find the first and third...Ch. 3.3 - For the data set Find the 58th percentile. Find...Ch. 3.3 - For the data set Find the 80th percentile. Find...Ch. 3.3 - The following TI-84 Plus display presents the...Ch. 3.3 - Prob. 26ECh. 3.3 - Standardized tests: In a recent year, the mean...Ch. 3.3 - A fish story: The mean length of one-year-old...Ch. 3.3 - Blood pressure in men: The three quartiles for...Ch. 3.3 - Blood pressure in women: The article referred to...Ch. 3.3 - Hazardous waste: Following is a list of the number...Ch. 3.3 - Cholesterol levels: The National Health and...Ch. 3.3 - Commuting to work: Jamie drives to work every...Ch. 3.3 - Windy city by the bay: Following are wind speeds...Ch. 3.3 - Caffeine: Following are the number of grams of...Ch. 3.3 - Prob. 36ECh. 3.3 - Place your bets: In a recent year, 28 states in...Ch. 3.3 - Prob. 38ECh. 3.3 - Prob. 39ECh. 3.3 - Prob. 40ECh. 3.3 - Bragging rights: After learning his score on a...Ch. 3.3 - Who scored the highest? On a final exam in a large...Ch. 3.3 - Baseball salaries: In 2016, the Chicago Cubs...Ch. 3.3 - Prob. 44ECh. 3.3 - Prob. 45ECh. 3.3 - Prob. 46ECh. 3.3 - Prob. 47ECh. 3.3 - Boxplot possible? Following is the five-number...Ch. 3.3 - Unusual boxplot: Ten residents of a town were...Ch. 3.3 - Prob. 50ECh. 3.3 - Highly skewed data: Make up a data set in which...Ch. 3.3 - Highly skewed data: Make up a data set in which...Ch. 3.3 - Prob. 53ECh. 3.3 - Prob. 54ECh. 3.3 - z-scores and skewed data: Table 3.9 presents the...Ch. 3 - Of the mean, median and mode, which must be a...Ch. 3 - The prices (in dollars) for a sample of personal...Ch. 3 - Prob. 3CQCh. 3 - Prob. 4CQCh. 3 - Prob. 5CQCh. 3 - Prob. 6CQCh. 3 - Each of the following histograms represents a data...Ch. 3 - In Exercises 8—11, suppose that the mean...Ch. 3 - Prob. 9CQCh. 3 - In Exercises 8—11, suppose that the mean...Ch. 3 - Prob. 11CQCh. 3 - Prob. 12CQCh. 3 - Prob. 13CQCh. 3 - Prob. 14CQCh. 3 - Prob. 15CQCh. 3 - Prob. 1RECh. 3 - Prob. 2RECh. 3 - Prob. 3RECh. 3 - Prob. 4RECh. 3 - Prob. 5RECh. 3 - Prob. 6RECh. 3 - Measure that ball: Each of 16 students measured...Ch. 3 - Prob. 8RECh. 3 - Rivets: A machine makes rivets that are used in...Ch. 3 - Prob. 10RECh. 3 - Prob. 11RECh. 3 - Advertising costs: The amounts spent (in billions)...Ch. 3 - Prob. 13RECh. 3 - Prob. 14RECh. 3 - Prob. 15RECh. 3 - The U.S. Department of Labor annually publishes an...Ch. 3 - Explain why the Empirical Rule is more useful than...Ch. 3 - Prob. 3WAICh. 3 - Prob. 4WAICh. 3 - Percentiles are values that divide a data set into...Ch. 3 - Prob. 1CSCh. 3 - Prob. 2CSCh. 3 - Prob. 3CSCh. 3 - Prob. 4CSCh. 3 - Prob. 5CSCh. 3 - Prob. 6CSCh. 3 - Prob. 7CSCh. 3 - Prob. 8CSCh. 3 - Electronic devices contain electric circuits...
Knowledge Booster
Background pattern image
Statistics
Learn more about
Need a deep-dive on the concept behind this application? Look no further. Learn more about this topic, statistics and related others by exploring similar questions and additional content below.
Recommended textbooks for you
Text book image
Glencoe Algebra 1, Student Edition, 9780079039897...
Algebra
ISBN:9780079039897
Author:Carter
Publisher:McGraw Hill
The Shape of Data: Distributions: Crash Course Statistics #7; Author: CrashCourse;https://www.youtube.com/watch?v=bPFNxD3Yg6U;License: Standard YouTube License, CC-BY
Shape, Center, and Spread - Module 20.2 (Part 1); Author: Mrmathblog;https://www.youtube.com/watch?v=COaid7O_Gag;License: Standard YouTube License, CC-BY
Shape, Center and Spread; Author: Emily Murdock;https://www.youtube.com/watch?v=_YyW0DSCzpM;License: Standard Youtube License