Elementary Statistics ( 3rd International Edition ) Isbn:9781260092561
3rd Edition
ISBN: 9781259969454
Author: William Navidi Prof.; Barry Monk Professor
Publisher: McGraw-Hill Education
bartleby

Concept explainers

bartleby

Videos

Textbook Question
Book Icon
Chapter 3.3, Problem 31E

Hazardous waste: Following is a list of the number of hazardous waste sites in each of the 50 states of the United States in a recent year. The list has been sorted into numerical order.

Chapter 3.3, Problem 31E, Hazardous waste: Following is a list of the number of hazardous waste sites in each of the 50 states

  1. Find the first and third quartiles of these data.
  2. Find the median of these data.
  3. Find the upper and lower outlier boundaries.
  4. Are there any outliers? If so, list them.
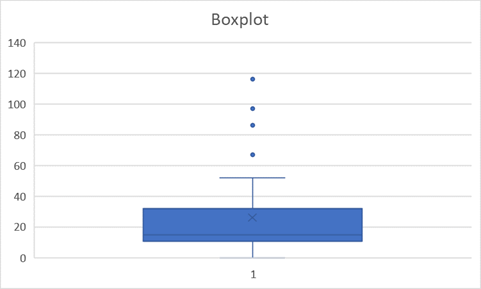
  5. Construct a boxplot for these data.
  6. Describe the shape of this distribution.
  7. What is the 30th percentile?
  8. What is the 85th percentile?
  9. The state of Georgia has 16 hazardous waste sites. What percentile is this?

a)

Expert Solution
Check Mark
To determine

To find the first and third quartiles of the given data.

Answer to Problem 31E

First quartile = 10.5 and third quartile = 32

Explanation of Solution

Formula:

First quartile Q1=14(n+1)thvalue

Third quartile Q3=34(n+1)thvalue

Calculation:

Given data sorted in ascending order:

    x
    09142040
    19142148
    211142549
    212142649
    312152952
    512153067
    612153286
    912163297
    913193297
    9131938116

Here, n = 50

First need to find First quartile and third quartile

First Quartile:

   Q 1 = 1 4 (50+1) th value Q 1 = 1 4 (51) th value Q 1 = (12.75) th valueQ1=9+0.75×(119)Q1=10.5

First quartile is 10.5

Third quartile:

   Q 3 = 3 4 (n+1) th value

   Q 3 = 3 4 (50+1) th value

   Q 3 = 3 4 (51) th value

   Q 3 = (38.25) th value

   Q 3 =32+ 1 4 ×(3838)

   Q 3 =32

Third quartile is 32

b)

Expert Solution
Check Mark
To determine

To find median of the data.

Answer to Problem 31E

Median is 15

Explanation of Solution

Formula:

  median=( n+12)thvalue

Calculation:

  median=( 50+1 2)thvaluemedian=(25.5)thvalueMedian=15+152Median=15

c)

Expert Solution
Check Mark
To determine

To find upper and lower outlier boundaries.

Answer to Problem 31E

Lower outlier boundary is -21.5

Upper outlier boundary is 64.25

Explanation of Solution

  Q1=10.5Q3=32

Formula:

IQR:

  IQR=Q3Q1

Calculation:

  IQR = Q3Q1IQR = 32-10.5IQR = 21.5

Therefore,

  Lower outlier limit = Q11.5 × IQRLower outlier limit = 10.5-1.5×21.5Lower outlier limit = -21.5AndUpper outlier limit = Q3+1.5 × IQRUpper outlier limit = 32+1.5×21.5Upper outlier limit = 64.25

d)

Expert Solution
Check Mark
To determine

To find the list of outliers.

Answer to Problem 31E

The outlier points are 67,86,97,97,116

Explanation of Solution

Outliers are those values which are less than Q11.5 × IQR and greater than Q3+1.5 × IQR .

Here,

Lower outlier boundary is -21.5

Upper outlier boundary is 64.5

There is no any value less than -21.5. But there are five values larger than 64.5 which are:

67,86,97,97,116

Hence outlier points are 67,86,97,97,116

e)

Expert Solution
Check Mark
To determine

To construct a boxplot from given data

Explanation of Solution

Boxplot from given data:

  Elementary Statistics ( 3rd International Edition ) Isbn:9781260092561, Chapter 3.3, Problem 31E

f)

Expert Solution
Check Mark
To determine

To find shape of the distribution

Answer to Problem 31E

The shape of the distribution is positively-skewed.

Explanation of Solution

Here, median is close to first quarter. Hence the shape of the distribution is positively-skewed.

g)

Expert Solution
Check Mark
To determine

To find 30th percentile

Answer to Problem 31E

30th percentile is 12

Explanation of Solution

  PercentilePosition=(n+1)P100PercentilePosition=(50+1)×30100PercentilePosition=15.3

Therefore,

  P30=12+0.3×(1212)=12

h)

Expert Solution
Check Mark
To determine

To find 85th percentile

Answer to Problem 31E

85th percentile is 49

Explanation of Solution

  PercentilePosition=(n+1)P100PercentilePosition=(48+1)×85100PercentilePosition=43.35

Therefore,

  P85=49+0.35×(4949)=49

h)

Expert Solution
Check Mark
To determine

To find percentile rank of Georgia.

Answer to Problem 31E

Percentile rank of Georgia at 16 is 54%

Explanation of Solution

Formula:

  Percentilerankofx=no.ofvaluesbelowxn×100

Calculation:

  Percentilerankof16=2750×100Percentilerankof16=54%

Want to see more full solutions like this?

Subscribe now to access step-by-step solutions to millions of textbook problems written by subject matter experts!

Chapter 3 Solutions

Elementary Statistics ( 3rd International Edition ) Isbn:9781260092561

Ch. 3.1 - Find the mean, median, and mode for the following...Ch. 3.1 - Find the mean, median, and mode for the following...Ch. 3.1 - In Exercises 21—24, use the given frequency...Ch. 3.1 - In Exercises 21—24, use the given frequency...Ch. 3.1 - In Exercises 21—24, use the given frequency...Ch. 3.1 - In Exercises 21—24, use the given frequency...Ch. 3.1 - Use the properties of the mean and median to...Ch. 3.1 - Use the properties of the mean and median to...Ch. 3.1 - Use the properties of the mean and median to...Ch. 3.1 - Use the properties of the mean and median to...Ch. 3.1 - Find the mean, median, and mode of the data in the...Ch. 3.1 - Find the mean, median, and mode of the data in the...Ch. 3.1 - Facebook friends: In a study of Facebook users...Ch. 3.1 - Mean and median height: The National Center for...Ch. 3.1 - Life expectancy: According to the National Vital...Ch. 3.1 - Prob. 34ECh. 3.1 - Hamburgers: An ABC News story reported the number...Ch. 3.1 - Great swimmer: In the 2016 Olympic Games, Michael...Ch. 3.1 - Mobile apps: The following table presents the...Ch. 3.1 - Prob. 38ECh. 3.1 - Whats your favorite TV show? The following tables...Ch. 3.1 - Prob. 40ECh. 3.1 - Gas prices: The following table presents the...Ch. 3.1 - Prob. 42ECh. 3.1 - Heavy football players: Following are the weights,...Ch. 3.1 - Prob. 44ECh. 3.1 - Flu season: The following tables present the...Ch. 3.1 - News flash: The following table presents the...Ch. 3.1 - Commercial break: Following are the amounts spent...Ch. 3.1 - Prob. 48ECh. 3.1 - Dont drink and drive: The Insurance Institute for...Ch. 3.1 - Prob. 50ECh. 3.1 - Be my Valentine: The following frequency...Ch. 3.1 - Get your degree: The following frequency...Ch. 3.1 - Prob. 53ECh. 3.1 - Take in a show: The following table presents the...Ch. 3.1 - Prob. 55ECh. 3.1 - Sources of news: A sample of 32 U.S. adults was...Ch. 3.1 - Find the mean: The National Center for Health...Ch. 3.1 - Find the median: According to a recent Current...Ch. 3.1 - Find the median: In a recent year, approximately...Ch. 3.1 - Find the median: The National Health and Nutrition...Ch. 3.1 - Heights: There are 2500 women and 2000 men...Ch. 3.1 - Prob. 62ECh. 3.1 - Heights: There are 35 students in a class. Fifteen...Ch. 3.1 - Prob. 64ECh. 3.1 - Prob. 65ECh. 3.1 - Prob. 66ECh. 3.1 - Whats the score? Jermaine has entered a bowling...Ch. 3.1 - Whats your grade? Addison has been told that her...Ch. 3.1 - Weighted mean: Rachel worked at three part-time...Ch. 3.1 - Weighted mean: In Jacobs statistics class, the...Ch. 3.1 - Mean or median? The Smith family in Example 3.5...Ch. 3.1 - Prob. 72ECh. 3.1 - Prob. 73ECh. 3.1 - Prob. 74ECh. 3.1 - Prob. 75ECh. 3.1 - Prob. 76ECh. 3.1 - Prob. 77ECh. 3.1 - Prob. 78ECh. 3.1 - Prob. 79ECh. 3.1 - Prob. 80ECh. 3.1 - Prob. 81ECh. 3.1 - Prob. 82ECh. 3.2 - In Exercises 11—14, fill in each blank with the...Ch. 3.2 - In Exercises 11—14, fill in each blank with the...Ch. 3.2 - In Exercises 11—14, fill in each blank with the...Ch. 3.2 - In Exercises 11—14, fill in each blank with the...Ch. 3.2 - In Exercises 15—18, determine whether the...Ch. 3.2 - In Exercises 15—18, determine whether the...Ch. 3.2 - In Exercises 15—18, determine whether the...Ch. 3.2 - In Exercises 15—18, determine whether the...Ch. 3.2 - Find the sample variance and standard deviation...Ch. 3.2 - Find the sample variance and standard deviation...Ch. 3.2 - Find the sample variance and standard deviation...Ch. 3.2 - Find the population variance and standard...Ch. 3.2 - Find the population variance and standard...Ch. 3.2 - Find the population variance and standard...Ch. 3.2 - Approximate the sample variance and standard...Ch. 3.2 - Approximate the sample variance and standard...Ch. 3.2 - Approximate the population variance and standard...Ch. 3.2 - Approximate the population variance and standard...Ch. 3.2 - Distances of the eight planets from the sun, in...Ch. 3.2 - A survey was taken in which people were asked how...Ch. 3.2 - The following TI-84 Plus display presents some...Ch. 3.2 - The following TI-84 Plus display presents some...Ch. 3.2 - The following TI-84 Plus display presents some...Ch. 3.2 - The following TI-84 Plus display presents some...Ch. 3.2 - Amazon: The following table presents the retail...Ch. 3.2 - Sports car or convertible? The following table...Ch. 3.2 - Heavy football players: Following are the weights,...Ch. 3.2 - Beer: The following table presents the number of...Ch. 3.2 - Whats your favorite TV show? The following tables...Ch. 3.2 - House prices: The following table presents prices,...Ch. 3.2 - Stock prices: Following are the closing prices of...Ch. 3.2 - Prob. 42ECh. 3.2 - Time to review: The following table presents the...Ch. 3.2 - Age distribution: The ages of residents of Banks...Ch. 3.2 - Lunch break: In a recent survey of 655 working...Ch. 3.2 - Pay your bills: In a large sample of customer...Ch. 3.2 - Newborn babies: A study conducted by the Center...Ch. 3.2 - Internet providers: In a survey of 600 homeowners...Ch. 3.2 - Lunch break: For the data in Exercise 45, estimate...Ch. 3.2 - Pay your bills: For the data in Exercise 46,...Ch. 3.2 - Newborn babies: For the data in Exercise 47,...Ch. 3.2 - Internet providers: For the data in Exercise 48,...Ch. 3.2 - Prob. 53ECh. 3.2 - Empirical Rule OK? The following histogram...Ch. 3.2 - Empirical Rule OK? The following histogram...Ch. 3.2 - Empirical Rule OK? The following histogram...Ch. 3.2 - Whats the temperature? The temperature in a...Ch. 3.2 - Find the standard deviation: The National Center...Ch. 3.2 - Find the standard deviation: The National Center...Ch. 3.2 - Price of electricity: The Energy Information...Ch. 3.2 - Possible or impossible? A data set has a mean of...Ch. 3.2 - Possible or impossible? A data set has a mean of...Ch. 3.2 - Prob. 63ECh. 3.2 - Prob. 64ECh. 3.2 - Height and weight: A Naona1 Center for Health...Ch. 3.2 - Test scores: Scores on a statistics exam had a...Ch. 3.2 - Mean absolute deviation: A measure of spread that...Ch. 3.2 - Prob. 68ECh. 3.3 - In Exercises 9—12, fill in each blank with the...Ch. 3.3 - In Exercises 9—12, fill in each blank with the...Ch. 3.3 - In Exercises 9—12, fill in each blank with the...Ch. 3.3 - In Exercises 9—12, fill in each blank with the...Ch. 3.3 - In Exercises 13—16, determine whether the...Ch. 3.3 - In Exercises 13—16, determine whether the...Ch. 3.3 - In Exercises 13—16, determine whether the...Ch. 3.3 - In Exercises 13—16, determine whether the...Ch. 3.3 - A popu1aon has mean =7 and standard deviation =2....Ch. 3.3 - A population has mean =25 and standard deviation...Ch. 3.3 - In Exercises 19 and 20, identify the outlier. Then...Ch. 3.3 - Prob. 20ECh. 3.3 - For the data set 37 82 20 25 31 10 41 44 4 36 68...Ch. 3.3 - For the data set Find the first and third...Ch. 3.3 - For the data set Find the 58th percentile. Find...Ch. 3.3 - For the data set Find the 80th percentile. Find...Ch. 3.3 - The following TI-84 Plus display presents the...Ch. 3.3 - Prob. 26ECh. 3.3 - Standardized tests: In a recent year, the mean...Ch. 3.3 - A fish story: The mean length of one-year-old...Ch. 3.3 - Blood pressure in men: The three quartiles for...Ch. 3.3 - Blood pressure in women: The article referred to...Ch. 3.3 - Hazardous waste: Following is a list of the number...Ch. 3.3 - Cholesterol levels: The National Health and...Ch. 3.3 - Commuting to work: Jamie drives to work every...Ch. 3.3 - Windy city by the bay: Following are wind speeds...Ch. 3.3 - Caffeine: Following are the number of grams of...Ch. 3.3 - Prob. 36ECh. 3.3 - Place your bets: In a recent year, 28 states in...Ch. 3.3 - Prob. 38ECh. 3.3 - Prob. 39ECh. 3.3 - Prob. 40ECh. 3.3 - Bragging rights: After learning his score on a...Ch. 3.3 - Who scored the highest? On a final exam in a large...Ch. 3.3 - Baseball salaries: In 2016, the Chicago Cubs...Ch. 3.3 - Prob. 44ECh. 3.3 - Prob. 45ECh. 3.3 - Prob. 46ECh. 3.3 - Prob. 47ECh. 3.3 - Boxplot possible? Following is the five-number...Ch. 3.3 - Unusual boxplot: Ten residents of a town were...Ch. 3.3 - Prob. 50ECh. 3.3 - Highly skewed data: Make up a data set in which...Ch. 3.3 - Highly skewed data: Make up a data set in which...Ch. 3.3 - Prob. 53ECh. 3.3 - Prob. 54ECh. 3.3 - z-scores and skewed data: Table 3.9 presents the...Ch. 3 - Of the mean, median and mode, which must be a...Ch. 3 - The prices (in dollars) for a sample of personal...Ch. 3 - Prob. 3CQCh. 3 - Prob. 4CQCh. 3 - Prob. 5CQCh. 3 - Prob. 6CQCh. 3 - Each of the following histograms represents a data...Ch. 3 - In Exercises 8—11, suppose that the mean...Ch. 3 - Prob. 9CQCh. 3 - In Exercises 8—11, suppose that the mean...Ch. 3 - Prob. 11CQCh. 3 - Prob. 12CQCh. 3 - Prob. 13CQCh. 3 - Prob. 14CQCh. 3 - Prob. 15CQCh. 3 - Prob. 1RECh. 3 - Prob. 2RECh. 3 - Prob. 3RECh. 3 - Prob. 4RECh. 3 - Prob. 5RECh. 3 - Prob. 6RECh. 3 - Measure that ball: Each of 16 students measured...Ch. 3 - Prob. 8RECh. 3 - Rivets: A machine makes rivets that are used in...Ch. 3 - Prob. 10RECh. 3 - Prob. 11RECh. 3 - Advertising costs: The amounts spent (in billions)...Ch. 3 - Prob. 13RECh. 3 - Prob. 14RECh. 3 - Prob. 15RECh. 3 - The U.S. Department of Labor annually publishes an...Ch. 3 - Explain why the Empirical Rule is more useful than...Ch. 3 - Prob. 3WAICh. 3 - Prob. 4WAICh. 3 - Percentiles are values that divide a data set into...Ch. 3 - Prob. 1CSCh. 3 - Prob. 2CSCh. 3 - Prob. 3CSCh. 3 - Prob. 4CSCh. 3 - Prob. 5CSCh. 3 - Prob. 6CSCh. 3 - Prob. 7CSCh. 3 - Prob. 8CSCh. 3 - Electronic devices contain electric circuits...
Knowledge Booster
Background pattern image
Statistics
Learn more about
Need a deep-dive on the concept behind this application? Look no further. Learn more about this topic, statistics and related others by exploring similar questions and additional content below.
Recommended textbooks for you
Text book image
Glencoe Algebra 1, Student Edition, 9780079039897...
Algebra
ISBN:9780079039897
Author:Carter
Publisher:McGraw Hill
Text book image
Holt Mcdougal Larson Pre-algebra: Student Edition...
Algebra
ISBN:9780547587776
Author:HOLT MCDOUGAL
Publisher:HOLT MCDOUGAL
Text book image
Big Ideas Math A Bridge To Success Algebra 1: Stu...
Algebra
ISBN:9781680331141
Author:HOUGHTON MIFFLIN HARCOURT
Publisher:Houghton Mifflin Harcourt
The Shape of Data: Distributions: Crash Course Statistics #7; Author: CrashCourse;https://www.youtube.com/watch?v=bPFNxD3Yg6U;License: Standard YouTube License, CC-BY
Shape, Center, and Spread - Module 20.2 (Part 1); Author: Mrmathblog;https://www.youtube.com/watch?v=COaid7O_Gag;License: Standard YouTube License, CC-BY
Shape, Center and Spread; Author: Emily Murdock;https://www.youtube.com/watch?v=_YyW0DSCzpM;License: Standard Youtube License