FIRST CRSE.IN DIFF.EQUAT..-ACCESS
11th Edition
ISBN: 9781337652469
Author: ZILL
Publisher: CENGAGE L
expand_more
expand_more
format_list_bulleted
Concept explainers
Videos
Textbook Question
Chapter 3.2, Problem 4E
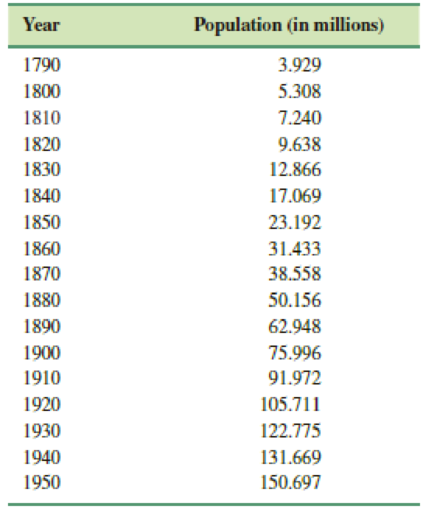
- (a) Census data for the United States between 1790 and 1950 are given in Table 3.2.1. Construct a logistic population model using the data from 1790, 1850, and 1910.
- (b) Construct a table comparing actual census population with the population predicted by the model in part (a). Compute the error and the percentage error for each entry pair.
TABLE 3.2.1
Expert Solution & Answer

Trending nowThis is a popular solution!

Students have asked these similar questions
The November 24, 2001, issue of The Economist published economic data for 15
industrialized nations. Included were the percent changes in gross domestic product (GDP),
industrial production (IP), consumer prices (CP), and producer prices (PP) from Fall 2000
to Fall 2001, and the unemployment rate in Fall 2001 (UNEMP). An economist wants to
construct a model to predict GDP from the other variables. A fit of the model
GDP = , + P,IP + 0,UNEMP + f,CP + P,PP + €
yields the following output:
The regression equation is
GDP = 1.19 + 0.17 IP + 0.18 UNEMP + 0.18 CP – 0.18 PP
Predictor
Coef SE Coef
тР
Constant
1.18957 0.42180 2.82 0.018
IP
0.17326 0.041962 4.13 0.002
UNEMP
0.17918 0.045895 3.90 0.003
CP
0.17591 0.11365 1.55 0.153
PP
-0.18393 0.068808 -2.67 0.023
Predict the percent change in GDP for a country with IP = 0.5, UNEMP = 5.7, CP =
3.0, and PP = 4.1.
a.
b.
If two countries differ in unemployment rate by 1%, by how much would you predict
their percent changes in GDP to differ, other…
The electric power consumed each month by a chemical plant is thought to be related to the average ambient temperature x1, the number of days in the month x2, the average product
purity x3, and the tons of product produced x4. The past year's historical data are available and are presented in the following table.
240
25
24
91
100
236
31
21
90
95
290
45
24
88
110
274
60
25
87
88
25
26
25
301
65
91
94
316
72
94
99
300
80
87
97
84
75
296
25
86
96
267
24
88
110
276
60
25
91
105
288
50
38
25
23
90
100
261
89
98
If y= ao+a1X1 +a2x2+Q3X3+Q4X4 represents the regression model. What is the value of a2? Use 2 decimal places.
Given:(1, 2.0), (1.5, 3.5), (2, 4.0), (4, 5.8), (6, 7.0), (8, 7.8).(a) use a graphing utility to create a scatter plot of the data, (b) decide whether the data could best be modeled by a linear model, an exponential model, or a logarithmic model, (c) explain why you chose the model you did in part (b), (d) use the regression feature of the graphing utility to find the model you chose in part (b) for the data and graph the model with the scatter plot, and (e) determine how well the model you chose fits the data.
Chapter 3 Solutions
FIRST CRSE.IN DIFF.EQUAT..-ACCESS
Ch. 3.1 - The population of a community is known to increase...Ch. 3.1 - Suppose it is known that the population of the...Ch. 3.1 - The population of a town grows at a rate...Ch. 3.1 - The population of bacteria in a culture grows at a...Ch. 3.1 - The radioactive isotope of lead, Pb-209, decays at...Ch. 3.1 - Initially 100 milligrams of a radioactive...Ch. 3.1 - Determine the half-life of the radioactive...Ch. 3.1 - Consider the initial-value problem dA/dt = kA,...Ch. 3.1 - When a vertical beam of light passes through a...Ch. 3.1 - When interest is compounded continuously, the...
Ch. 3.1 - Carbon Dating Archaeologists used pieces of burned...Ch. 3.1 - The Shroud of Turin, which shows the negative...Ch. 3.1 - Newtons Law of Cooling/Warming A thermometer is...Ch. 3.1 - A thermometer is taken from an inside room to the...Ch. 3.1 - A small metal bar, whose initial temperature was...Ch. 3.1 - Two large containers A and B of the same size are...Ch. 3.1 - A thermometer reading 70 F is placed in an oven...Ch. 3.1 - At t = 0 a sealed test tube containing a chemical...Ch. 3.1 - A dead body was found within a closed room of a...Ch. 3.1 - The rate at which a body cools also depends on its...Ch. 3.1 - A tank contains 200 liters of fluid in which 30...Ch. 3.1 - Solve Problem 21 assuming that pure water is...Ch. 3.1 - A large tank is filled to capacity with 500...Ch. 3.1 - In Problem 23, what is the concentration c(t) of...Ch. 3.1 - Solve Problem 23 under the assumption that the...Ch. 3.1 - Determine the amount of salt in the tank at time t...Ch. 3.1 - A large tank is partially filled with 100 gallons...Ch. 3.1 - In Example 5 the size of the tank containing the...Ch. 3.1 - A 30-volt electromotive force is applied to an...Ch. 3.1 - Prob. 30ECh. 3.1 - A 100-volt electromotive force is applied to an...Ch. 3.1 - A 200-volt electromotive force is applied to an...Ch. 3.1 - An electromotive force E(t)={120,0t200,t20 is...Ch. 3.1 - An LR-series circuit has a variable inductor with...Ch. 3.1 - Air Resistance In (14) of Section 1.3 we saw that...Ch. 3.1 - How High?No Air Resistance Suppose a small...Ch. 3.1 - How High?Linear Air Resistance Repeat Problem 36,...Ch. 3.1 - Skydiving A skydiver weighs 125 pounds, and her...Ch. 3.1 - Rocket Motion Suppose a small single-stage rocket...Ch. 3.1 - Rocket MotionContinued In Problem 39 suppose of...Ch. 3.1 - Evaporating Raindrop As a raindrop falls, it...Ch. 3.1 - Prob. 42ECh. 3.1 - Prob. 43ECh. 3.1 - Constant-Harvest model A model that describes the...Ch. 3.1 - Drug Dissemination A mathematical model for the...Ch. 3.1 - Memorization When forgetfulness is taken into...Ch. 3.1 - Heart Pacemaker A heart pacemaker, shown in Figure...Ch. 3.1 - Sliding Box (a) A box of mass m slides down an...Ch. 3.1 - Sliding Box—Continued
In Problem 48 let s(t) be...Ch. 3.1 - What Goes Up (a) It is well known that the model...Ch. 3.2 - The number N(t) of supermarkets throughout the...Ch. 3.2 - The number N(t) of people in a community who are...Ch. 3.2 - A model for the population P(t) in a suburb of a...Ch. 3.2 - Census data for the United States between 1790 and...Ch. 3.2 - (a) If a constant number h of fish are harvested...Ch. 3.2 - Investigate the harvesting model in Problem 5 both...Ch. 3.2 - Repeat Problem 6 in the case a = 5, b = 1, h = 7.Ch. 3.2 - (a) Suppose a = b = 1 in the Gompertz differential...Ch. 3.2 - Two chemicals A and B are combined to form a...Ch. 3.2 - Solve Problem 9 if 100 grams of chemical A is...Ch. 3.2 - Leaking cylindrical tank A tank in the form of a...Ch. 3.2 - Leaking cylindrical tank—continued When friction...Ch. 3.2 - Leaking Conical Tank A tank in the form of a...Ch. 3.2 - Inverted Conical Tank Suppose that the conical...Ch. 3.2 - Air Resistance A differential equation for the...Ch. 3.2 - How High?Nonlinear Air Resistance Consider the...Ch. 3.2 - That Sinking Feeling (a) Determine a differential...Ch. 3.2 - Solar Collector The differential equation...Ch. 3.2 - Tsunami (a) A simple model for the shape of a...Ch. 3.2 - Evaporation An outdoor decorative pond in the...Ch. 3.2 - Doomsday equation Consider the differential...Ch. 3.2 - Doomsday or extinction Suppose the population...Ch. 3.2 - Skydiving A skydiver is equipped with a stopwatch...Ch. 3.2 - Prob. 27ECh. 3.2 - Old Man River In Figure 3.2.8(a) suppose that the...Ch. 3.2 - Prob. 29ECh. 3.2 - Prob. 30ECh. 3.2 - Prob. 31ECh. 3.2 - Prob. 32ECh. 3.2 - Time Drips By The clepsydra, or water clock, was a...Ch. 3.2 - (a) Suppose that a glass tank has the shape of a...Ch. 3.2 - Prob. 35ECh. 3.3 - We have not discussed methods by which systems of...Ch. 3.3 - In Problem 1 suppose that time is measured in...Ch. 3.3 - Use the graphs in Problem 2 to approximate the...Ch. 3.3 - Construct a mathematical model for a radioactive...Ch. 3.3 - Potassium-40 Decay The chemical element potassium...Ch. 3.3 - Potassium-Argon Dating The knowledge of how K-40...Ch. 3.3 - Consider two tanks A and B, with liquid being...Ch. 3.3 - Use the information given in Figure 3.3.6 to...Ch. 3.3 - Two very large tanks A and B are each partially...Ch. 3.3 - Three large tanks contain brine, as shown in...Ch. 3.3 - Consider the Lotka-Volterra predator-prey model...Ch. 3.3 - Show that a system of differential equations that...Ch. 3.3 - Determine a system of first-order differential...Ch. 3.3 - Prob. 16ECh. 3.3 - SIR Model A communicable disease is spread...Ch. 3.3 - Prob. 18ECh. 3.3 - Prob. 19ECh. 3.3 - Prob. 20ECh. 3.3 - Mixtures Solely on the basis of the physical...Ch. 3.3 - Newtons Law of Cooling/Warming As shown in Figure...Ch. 3 - Answer Problems 1 and 2 without referring back to...Ch. 3 - Answer Problems 1 and 2 without referring back to...Ch. 3 - Prob. 3RECh. 3 - Air containing 0.06% carbon dioxide is pumped into...Ch. 3 - tzi the Iceman In September of 1991 two German...Ch. 3 - Prob. 6RECh. 3 - Prob. 7RECh. 3 - Suppose a cell is suspended in a solution...Ch. 3 - Suppose that as a body cools, the temperature of...Ch. 3 - According to Stefans law of radiation the absolute...Ch. 3 - Suppose an RC-series circuit has a variable...Ch. 3 - A classical problem in the calculus of variations...Ch. 3 - A model for the populations of two interacting...Ch. 3 - Initially, two large tanks A and B each hold 100...Ch. 3 - Prob. 15RECh. 3 - When all the curves in a family G(x, y, c1) = 0...Ch. 3 - Prob. 17RECh. 3 - Prob. 18RECh. 3 - Prob. 19RECh. 3 - Sawing Wood A long uniform piece of wood (cross...Ch. 3 - Solve the initial-value problem in Problem 20 when...Ch. 3 - Prob. 22RE
Knowledge Booster


Learn more about
Need a deep-dive on the concept behind this application? Look no further. Learn more about this topic, subject and related others by exploring similar questions and additional content below.Similar questions
- Does a linear, exponential, or logarithmic model best fit the data in Table 2? Find the model.arrow_forwardEnter the data from Table 2 into a graphing calculator and graph the ranking scatter plot. Determine whetherthe data from the table would likely represent a function that is linear, exponential, or logarithmic.arrow_forwardWhat might a scatterplot of data points look like if it were best described by a logarithmic model?arrow_forward
- Is carbon dating? Why does it work? Give an example in which carbon dating would be useful.arrow_forwardUrban Travel Times Population of cities and driving times are related, as shown in the accompanying table, which shows the 1960 population N, in thousands, for several cities, together with the average time T, in minutes, sent by residents driving to work. City Population N Driving time T Los Angeles 6489 16.8 Pittsburgh 1804 12.6 Washington 1808 14.3 Hutchinson 38 6.1 Nashville 347 10.8 Tallahassee 48 7.3 An analysis of these data, along with data from 17 other cities in the United States and Canada, led to a power model of average driving time as a function of population. a Construct a power model of driving time in minutes as a function of population measured in thousands b Is average driving time in Pittsburgh more or less than would be expected from its population? c If you wish to move to a smaller city to reduce your average driving time to work by 25, how much smaller should the city be?arrow_forwardAnswer 1 2 3 4arrow_forward
- The number of pounds of steam used per month by a chemical plant is thought to be related to the average ambient temperature (in °F) for that month. The past year's usage and temperature are shown in the following table. Month Temp(X) Usage(Y) Month Temp(X) Usage(Y) Jan 21 185.21 July 68 621.55 Feb 24 214.45 Aug 74 675.15 March 32 288.03 Sept 62 562.03 Apr 47 424.84 Oct 51 452.93 May 50 454.31 Nov |41 370.01 June 59 539.03 Dec 30 273.98 Estimate the intercept (beta0) and slope (beta1) regression coefficients. beta0 beta1 =arrow_forward31. Table 4.3 shows the population of Pennsylvania in each 10-year census between 1830 and 1950. Table 4.3 Population of Pennsylvania Population in Years since 1820 thousands 10 1348 20 1724 30 2312 40 2906 50 3522 60 4283 70 5258 80 6302 90 7665 100 8720 10 9631 120 9900 130 10,498 Source: Bureau of the Census, uS. Chamber of Cammerce. (a) Find the logistic regression for the data. (b) Graph the data in a scatter plot and superimpose the regres- sion curve. (c) Use the regression equation to predict the Pennsylvania popu- lation in the 2000 census. (d) In what year was the Pennsylvania population growing the fastest? What significant behavior does the graph of the regres- sion equation exhibit at that point? (e) What does the regression equation indicate about the popula- tion of Pennsylvania in the long run?arrow_forward2. Are rent rates influenced by the student population in a college town? Let rent be the average monthly rent paid on rental units in a college town in the United States. Let pop denote the total city population, avginc the average city income, and pctstu the student population as a percentage of the total population. One model to test for a relationship is log (rent) = Bo + B₁ log(pop) + ₂log (avginc) + B3pctstu + u, (i) State the null hypothesis that size of the student body relative to the population has no ceteris paribus effect on monthly rents. State the alternative that there is an effect. (ii) What signs do you expect for 3₁ and 3₂. Explain. (iii) The equation estimated using 1990 data for 64 college town is log (rent) = 0.043 + 0.066 log(pop) + 0.507 log (avginc) + 0.0056 pctstu (0.844) (0.039) (0.081) (0.0017) n = 64, R² = 0.458 What is wrong with the statement "A 10% increase in population is associated with about a 6.6% increase in rent"? (iv) Test the hypothesis stated in…arrow_forward
- (b) Estimate the standard errors of the slope and intercept. Round your answer to three decimal places (e.g. 98.765) se B, Round your answer to two decimal places (e.g. 98.76) se(bo ) = I (c) Test the hypothesis Ho: B1 = 10 versus H1:ß1 + 10using a = 0.01. v Họ and conclude the slope 10 at a = 0.01. (d) Test the hypothesis Ho: Bo = 0 versus H1: Bo # 0 using a = 0.01. Họ and conclude that the intercept v be included in the model.arrow_forward(e) Test the hypothesis Ho : B1 = 10 versus H1 :ß, # 10 using a = 0.01. Ho and conclude the slope v 10 at a = 0.01. (d) Test the hypothesis Ho : Bo = 0 versus H1 : Bo + 0 using a = 0.01. Ho and conclude that the intercept be included in the model.arrow_forwardYou collect data of average annual returns for Amazon Stock and Microsoft Stock and make the following table: (This data can be copied into Excel.) Year Amazon Return Microsoft Return 2013 0.5896 0.1221 2014 -0.2218 0.2416 2015 1.1778 0.1944 2016 0.1095 0.1200 2017 0.5596 0.3766 2018 0.2843 0.1874 2019 0.3216 0.5526 You use this data to answer the research question: are true population Amazon Returns greater than true population Microsoft Returns?arrow_forward
arrow_back_ios
SEE MORE QUESTIONS
arrow_forward_ios
Recommended textbooks for you
 Glencoe Algebra 1, Student Edition, 9780079039897...AlgebraISBN:9780079039897Author:CarterPublisher:McGraw Hill
 Big Ideas Math A Bridge To Success Algebra 1: Stu...AlgebraISBN:9781680331141Author:HOUGHTON MIFFLIN HARCOURTPublisher:Houghton Mifflin Harcourt
 Trigonometry (MindTap Course List)TrigonometryISBN:9781337278461Author:Ron LarsonPublisher:Cengage Learning
 Linear Algebra: A Modern IntroductionAlgebraISBN:9781285463247Author:David PoolePublisher:Cengage Learning
Glencoe Algebra 1, Student Edition, 9780079039897...
Algebra
ISBN:9780079039897
Author:Carter
Publisher:McGraw Hill
Big Ideas Math A Bridge To Success Algebra 1: Stu...
Algebra
ISBN:9781680331141
Author:HOUGHTON MIFFLIN HARCOURT
Publisher:Houghton Mifflin Harcourt
Trigonometry (MindTap Course List)
Trigonometry
ISBN:9781337278461
Author:Ron Larson
Publisher:Cengage Learning
Linear Algebra: A Modern Introduction
Algebra
ISBN:9781285463247
Author:David Poole
Publisher:Cengage Learning
Sampling Methods and Bias with Surveys: Crash Course Statistics #10; Author: CrashCourse;https://www.youtube.com/watch?v=Rf-fIpB4D50;License: Standard YouTube License, CC-BY
Statistics: Sampling Methods; Author: Mathispower4u;https://www.youtube.com/watch?v=s6ApdTvgvOs;License: Standard YouTube License, CC-BY