
Videos
Data from a 20-yr study show the number of new AIDS cases diagnosed among 20- to 24-yr-olds in the United States x years after the study began.
a. Approximate the interval(s) over which the number of new AIDS cases among 20- to 24-yr-olds increased
b. Approximate the interval(s) over which the number of new AIDS cases among 20- to 24-yr-olds decreased
c. How many turning points does the graph show?
d. Based on the number of turning points, what is the minimum degree of a polynomial function that could be used to model the data? would the leading
coefficient be positive or negative?
e. How many years after the study began was the number of new AIDS cases among 20- to 24-yr-olds the greatest?
f. What was the maximum number of new cases diagnosed in a single year?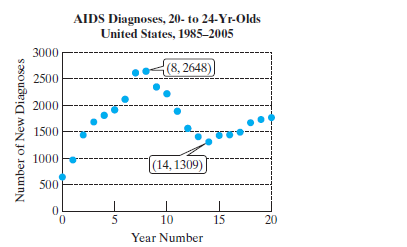
Want to see the full answer?
Check out a sample textbook solution
Chapter 3 Solutions
COLL.ALGEBRA & TRIG ACCESS


 Trigonometry (MindTap Course List)TrigonometryISBN:9781337278461Author:Ron LarsonPublisher:Cengage Learning
 Linear Algebra: A Modern IntroductionAlgebraISBN:9781285463247Author:David PoolePublisher:Cengage Learning
 Algebra & Trigonometry with Analytic GeometryAlgebraISBN:9781133382119Author:SwokowskiPublisher:Cengage
 Functions and Change: A Modeling Approach to Coll...AlgebraISBN:9781337111348Author:Bruce Crauder, Benny Evans, Alan NoellPublisher:Cengage Learning
 Glencoe Algebra 1, Student Edition, 9780079039897...AlgebraISBN:9780079039897Author:CarterPublisher:McGraw Hill