
Concept explainers
Videos
Cholesterol levels: The National Health and Nutrition Examination Survey (NHANES) measured the serum HDL cholesterol levels in a large number of women. Following is a sample of 40 HDL levels (in milligrams per deciliter) that are based on the results of that survey. They have been sorted into numerical order.
- a. Find the first and third
quartiles of these data. - b. Find the median of these data.
- c. Find the upper and lower outlier boundaries.
- d. Are there any outliers? If so, list them.
- e. Construct a boxplot for these data.
- f. Describe the shape of this distribution.
- g. What is the 20th percentile?
- h. What is the 67th percentile?
- i. One woman had a cholesterol level of 58. What percentile is this?
a.
Find the first and the third quartiles.
Answer to Problem 26E
The first and the third quartiles are 37 and 65.5 respectively.
Explanation of Solution
Calculation:
- The given information is a sample of 40 HDL cholesterol level obtained from the survey.
Three quartiles:
- The first quartile separates the lowest 25% of the observations from the other 75% of the observations. The first quartile is denoted by
- The second quartile separates the lower 50% of the observations from the other 50% of the observations. The second quartile is denoted by
- The third quartile separates the lowest 75% of the observations from the other 25% of the observations. The third quartile is denoted by
- Procedure for finding the first and the third quartile:
- Step 1: The observations should be arranged in increasing order.
- Step 2: The size of the data is n.
- For finding first quartile,
- For finding third quartile,
- Step 3: The quartile will be the average of the observation of the position L and the observation in position
- The observations are arranged in increasing order:
| 27 | 28 | 30 | 32 | 34 | 36 | 37 | 37 | 37 | 37 |
| 37 | 40 | 45 | 47 | 48 | 49 | 53 | 53 | 54 | 56 |
| 57 | 58 | 61 | 62 | 63 | 63 | 64 | 64 | 64 | 65 |
| 66 | 70 | 72 | 73 | 73 | 74 | 80 | 80 | 81 | 84 |
- The size of the data is
- For finding first quartile,
- Here, 10 is a whole number, hence the 1st quartile will be the observation of the average of 10th and the 11th observations.
- From the arranged observations the first quartile is
- For finding third quartile,
- Here, 30 is a whole number, hence the 3rd quartile will be the observation of the average of 30th and the 31st observations.
- From the arranged observations the third quartile is
Hence, the first and the third quartiles are 37 and 65.5 respectively.
b.
Find the median of the data.
Answer to Problem 26E
The median of the data is 56.5.
Explanation of Solution
Calculation:
Median:
Let
The steps for finding the median:
- The all data values should be arranged in ascending order.
- If the total number of data values, n is odd, then the median will be the middle value or if n is even, then the median will be the average of middle two values.
- The observations are arranged in increasing order:
| 27 | 28 | 30 | 32 | 34 | 36 | 37 | 37 | 37 | 37 |
| 37 | 40 | 45 | 47 | 48 | 49 | 53 | 53 | 54 | 56 |
| 57 | 58 | 61 | 62 | 63 | 63 | 64 | 64 | 64 | 65 |
| 66 | 70 | 72 | 73 | 73 | 74 | 80 | 80 | 81 | 84 |
- The size of the data is 40. That is,
- Hence, the sample size is even. Therefore, the median is the average of 20th and 21st observation.
- From the arranged observations the median is
Thus, the median of the data is 56.5.
c.
Find the lower and upper outlier boundaries.
Answer to Problem 26E
The lower and upper outlier boundaries are –5.75 and 108.25 respectively.
Explanation of Solution
Calculation:
Interquartile range:
- The interquartile range is the difference between the third quartile and first quartile. For detecting outlier this measure can be used.
- Interquartile range can be found as,
- From part (a), the first and the third quartiles are 37 and 65.5 respectively.
- Substitute these values in the interquartile range formula,
- Outlier boundaries:
- Lower outlier boundary is
- Upper outlier boundary is
- Where, the first quartile is denoted by
- Substitute these values in the formulae,
-
Thus, the lower and upper outlier boundaries are –5.75 and 108.25 respectively.
d.
Find the outliers.
Answer to Problem 26E
There is no outlier in the data.
Explanation of Solution
Calculation:
- Condition for outlier:
- If any observation is less than the lower outlier boundary, the observation will be outlier.
- If any observation is greater than the upper outlier boundary, the observation will be outlier.
From part (c), the lower and upper outlier boundaries are –5.75 and 108.25 respectively.
In the given data, all observations are greater than the lower outlier boundary and less than the upper outlier boundary.
Hence, there is no outlier in the data.
e.
Draw a boxplot of the data.
Answer to Problem 26E
The boxplot is given below,
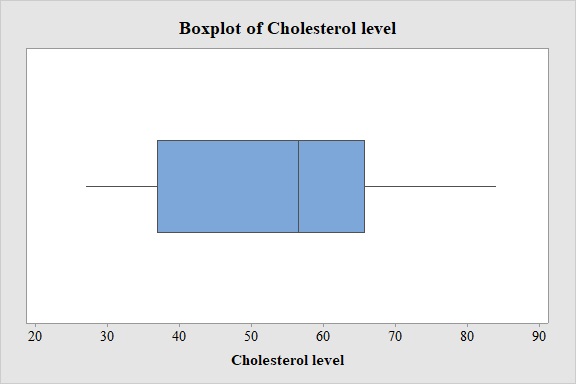
Explanation of Solution
Calculation:
- Boxplot:
Software procedure:
- Step-by-step procedure to draw a boxplot using the MINITAB software:
- Choose Graph > Boxplot.
- Choose Simple. Click OK.
- In Graph variables, enter the data of Cholesterol level.
- Click OK.
Output using the MINITAB software is given below:
- From the MINITAB output, it is clear that there is no outlier in the data.
f.
Explain the shape of the distribution.
Answer to Problem 26E
The data is slightly left skewed or it can be said that approximately symmetric.
Explanation of Solution
The rule for determining the skewness from the Boxplot:
- The data is right skewed if the median is closer to the 1st quartile than the 3rd quartile or the upper whisker is longer than the lower whisker.
- The data is left skewed if the median is closer to the 3rd quartile than the 1st quartile or the lower whisker is longer than the upper whisker.
- The data is approximately symmetric if the median is the middle point of 1st quartile and the 3rd quartile or the length of the upper whisker and the lower whisker is approximately same.
From the Boxplot of part (e), is clear that the median is slightly closer to the 3rd quartile than the 1st quartile, in other words, the upper whisker is slightly longer than the lower whisker.
By using the above rule, it can be said that the data is slightly left skewed or it can be said that approximately symmetric.
g.
Find the 20th percentile of the data.
Answer to Problem 26E
The 20th percentile is 37.
Explanation of Solution
Calculation:
pth percentile:
The pth percentile separates the lowest p% of the observations from the highest
Procedure for finding pth percentile:
- Step 1: The observations should be arranged in increasing order.
- Step 2: The size of the data is n.
For finding pth percentile,
- Step 3: The pth percentile will be the average of the observation of the position L and the observation in position
- The observations are arranged in increasing order:
| 27 | 28 | 30 | 32 | 34 | 36 | 37 | 37 | 37 | 37 |
| 37 | 40 | 45 | 47 | 48 | 49 | 53 | 53 | 54 | 56 |
| 57 | 58 | 61 | 62 | 63 | 63 | 64 | 64 | 64 | 65 |
| 66 | 70 | 72 | 73 | 73 | 74 | 80 | 80 | 81 | 84 |
- The size of the data is
- For finding 20th percentile,
- Here, 8 is a whole number, hence the 20th percentile will be the average of the observations in the position of 8th and 9th.
- From the arranged observations the 20th percentile is
Hence, the 20th percentile is 37.
h.
Find the 67th percentile of the data.
Answer to Problem 26E
The 67th percentile is 64.
Explanation of Solution
Calculation:
- The observations are arranged in increasing order:
| 27 | 28 | 30 | 32 | 34 | 36 | 37 | 37 | 37 | 37 |
| 37 | 40 | 45 | 47 | 48 | 49 | 53 | 53 | 54 | 56 |
| 57 | 58 | 61 | 62 | 63 | 63 | 64 | 64 | 64 | 65 |
| 66 | 70 | 72 | 73 | 73 | 74 | 80 | 80 | 81 | 84 |
- The size of the data is
- For finding 67th percentile,
- Here, 26.8 is not a whole number, hence the 67th percentile will be the observation in the 27th position.
- From the arranged observations the 67th percentile is 64.
Hence, the 67th percentile is 64.
i.
Find the percentile for the given cholesterol level.
Answer to Problem 26E
The value is of 54th percentile.
Explanation of Solution
Calculation:
It is given that a woman had a cholesterol level of 58.
Procedure for finding the percentile for a given observation:
- The observations should be arranged in ascending order.
- If the observation is x, then the percentile of the observation is,
If the value is not a whole number the nearest whole number will be the percentile.
- The observations are arranged in increasing order:
| 27 | 28 | 30 | 32 | 34 | 36 | 37 | 37 | 37 | 37 |
| 37 | 40 | 45 | 47 | 48 | 49 | 53 | 53 | 54 | 56 |
| 57 | 58 | 61 | 62 | 63 | 63 | 64 | 64 | 64 | 65 |
| 66 | 70 | 72 | 73 | 73 | 74 | 80 | 80 | 81 | 84 |
Here,
From the observations, it is clear that there are 21 observations which are less than 58. Total number of observation is 40.
Hence, the percentile is,
- Here, 53.75 is not a whole number, hence value is in 54th percentile.
Hence, the value is of 54th percentile.
Want to see more full solutions like this?
Chapter 3 Solutions
ESSENTIAL STATISTICS(FD)


 Glencoe Algebra 1, Student Edition, 9780079039897...AlgebraISBN:9780079039897Author:CarterPublisher:McGraw Hill