
Videos
Boxplots. In Exercises 29-32, use the given data to construct a boxplot and identify the 5-number summary.
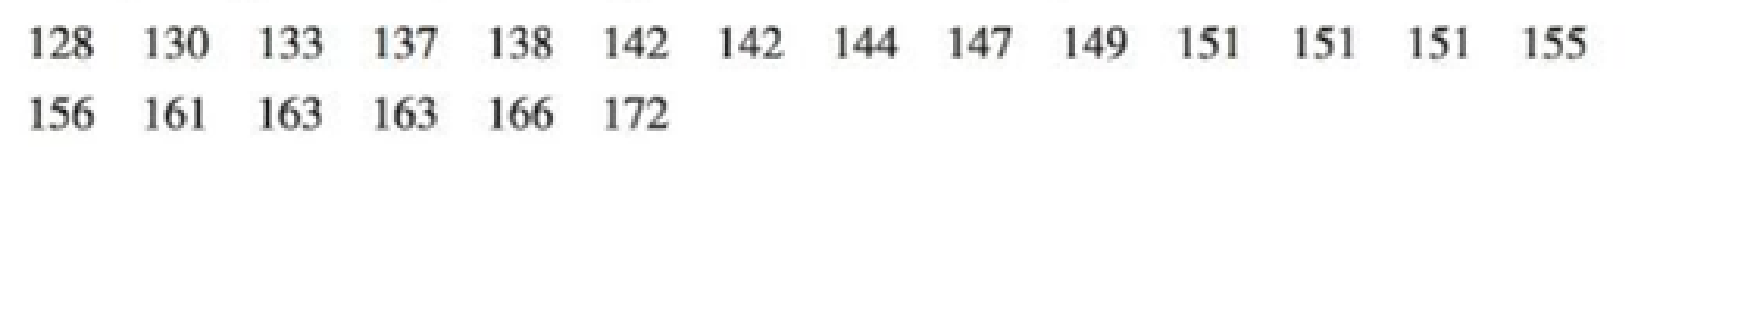
31. Radiation in Baby Teeth Listed below are amounts of strontium-90 (in millibecquerels, or mBq) in a simple random sample of baby teeth obtained from Pennsylvania residents born after 1979 (based on data from “An Unexpected Rise in Strontium-90 in U.S. Deciduous Teeth in the 1990s,” by Mangano et. al., Science of the Total Environment).

Learn your wayIncludes step-by-step video

Chapter 3 Solutions
Essentials of Statistics (6th Edition)
Additional Math Textbook Solutions
Statistics for Business and Economics (13th Edition)
Essentials of Statistics, Books a la Carte Edition (5th Edition)
Elementary Statistics: Picturing the World (7th Edition)
Basic Business Statistics, Student Value Edition (13th Edition)
Introductory Statistics (2nd Edition)


- help please answer in text form with proper workings and explanation for each and every part and steps with concept and introduction no AI no copy paste remember answer must be in proper format with all workingarrow_forwardPineal Gland Study. Dr. Marquez hypothesized that fluoride had a deleterious effect on the pineal gland, which helps with sleeping. He measured the amount of fluoride in Americans and compared it to the fluoride level in Europeans, where its use in drinking water has been banned. He knew from reading the literature that the average fluoride level in Europeans was 40 parts per million (ppm). He collected a representative sample of 625 Americans and found that their fluoride level was 60 ppm with a standard deviation of 250 ppm. What is the value of the z-test statistic?arrow_forwardFluoride Exposure in Drinking Water Exercise 2.250 introduces a study showing that fluoride exposure might have long-term negative consequences for the offspring of pregnant women. Part of the study examines the effect of adding fluoride to tap water on mean fluoride concentration in women. Summary statistics for fluoride concentration (measured in mg/L) for the two groups are given in the table below. Tap water Fluoridated Non-fluoridated Conclusion: Sample size 141 228 Mean 0.69 0.40 St.Dev. 0.42 0.27 Find and interpret a 99% confidence interval for the mean increase in fluoride concentration for those with fluoridated tap water. Let Group 1 represent those with fluoridated tap water and Group 2 represent those without fluoridated tap water. Confidence interval: i to i (round to three decimal places)arrow_forward
- An article reported on a study in which each of 13 workers was provided with both a conventional shovel and a shovel whose blade was perforated with small holes. The authors of the cited article provided the following data on energy expenditure [kcal/kg(subject)/lb(clay)]. Worker: 2 4 5 6 Conventional: 0.0015 0.0015 0.0018 0.0022 0.001 0.0016 0.0028 Perforated: 0.0015 0.001 0.0019 0.0013 0.0011 0.0017 0.0024 Worker: 10 11 12 13 Conventional: 0.0021 0.0015 0.0014 0.0023 0.0017 0.002 Perforated: 0.0021 0.0013 0.0013 0.0017 0.0015 0.0013 n USE SALT Do these data provide convincing evidence that the mean energy expenditure using the conventional shovel exceeds that using the perforated shovel? Test the relevant hypotheses using a significance level of 0.05. (Use SALT to calculate the P-value. Use Hd = Hconventional - Hperforated Round your test statistic to one decimal place and your P-value to three decimal places.) t= df = p-value = State your conclusion. O we fail to reject H,. We have…arrow_forward2h. How long it takes paint to dry can have an impact on the production capacity of a business. An auto body & paint business invested in a paint-drying robot to speed up its process. An interesting question is, "Do all paint-drying robots have the same drying time?" To test this, suppose we sample five drying times for each of different brands of paint-drying robots. The time in minutes until the paint was dry enough for a second coat to be applied was recorded. Suppose the following data were obtained. Robot 1 Robot 2 Robot 3 Robot 4 127 145 134 149 137 133 144 141 135 143 137 136 125 146 137 141 141 128 128 153 Find the value of the test statistic. (Round your answer to two decimal places.) Find the p-value. (Round your answer to four decimal places.) p-value =arrow_forwardRandom collections of nine different solutions of a calcium compound were given to two laboratories, A and B. Each laboratory measured the calcium content (in mmol per liter) and reported the results. The data are paired by calcium compound. Compound 1 2 3 4 5 6 7 8 9 Lab A (x) 12.35 9.83 10.79 11.31 8.58 13.69 14.68 15.07 11.57 Lab B (y) 12.18 9.72 10.70 11.51 8.63 13.58 14.71 15.24 11.57 (a) Rank-order the data using 1 for the lowest calcium reading. Make a table of ranks to be used in a Spearman rank correlation test. Compound Lab A (x) Lab B (y) d = x − y d2 1 2 3 4 5 6 7 8 9 Σd2 = (b) Use a 5% level of significance to test for a monotone relation (either way) between ranks. Interpret the results. What is the level of significance? Compute the sample test statistic. (Round your answer to three decimal places.)arrow_forward
- State the p valuearrow_forward= Question Help Listed below are amounts of strontium-90 (in millibecquerels, or mBq) in a simple random sample of baby teeth obtained from residents in a region bom after 1979. Use the given data to construct a boxplot and identify the 5-number summary 122 123 125 129 131 133 133 136 139 143 143 143 141 O 146 149 152 154 156 159 165 The 5-number summary is.N. NN. and, all in mBq (Use ascending order. Type integers or decimals. Do not round.)arrow_forwardCh 14arrow_forward
- Q2.1 Colonoscopy A colonoscopy is a medical procedure used to detect abnormalities in the large intestine. It is used to find and remove precancerous polyps in the colon before they become cancerous. Separate random samples of people with and without cancer were taken and the number of people who had a colonoscopy were counted. Specific information is provided in the table. Colorectal Cancer No Colorectal 4123 Cancer Save Answer Do these data provide evidence that there is a difference in the population proportions of people who have had a colonoscopy in these groups? Q2.2 Conditions Sample Size 3550 Hypotheses: Write the appropriate hypotheses, including defining the parameters and identifying the subscripts appropriately. (Note: you are not required to use Greek letters. For example, writing sigma is sufficient for σ.) Save Answer Had a Colonoscopy 344 Q2.3 Mechanics Conditions: Explain how the Normal condition for this test has been met. 288 Save Answer Mechanics: Perform the…arrow_forwardListed below are amounts of strontium-90 (in millibecquerels, or mBq) in a simple random sample of baby teeth obtained from residents in a region born after 1979. Use the given data to construct a boxplot and identify the 5-number summary. a. The 5-number summary is all in mBq. (Use ascending order. Type integers or decimals. Do not round.) b. Which boxplot below represents the data?arrow_forwardRandom collections of nine different solutions of a calcium compound were given to two laboratories, A and B. Each laboratory measured the calcium content (in mmol per liter) and reported the results. The data are paired by calcium compound. Compound 1 2 3 4 5 6 7 8 9 Lab A (x) 15.36 12.83 8.81 11.30 13.59 9.66 10.72 14.05 11.54 Lab B (y) 15.17 12.72 8.69 11.45 13.63 9.63 10.75 14.23 11.55 (a) Rank-order the data using 1 for the lowest calcium reading. Make a table of ranks to be used in a Spearman rank correlation test. (b) Compute the sample test statistic. (Round your answer to three decimal places.)arrow_forward
 Holt Mcdougal Larson Pre-algebra: Student Edition...AlgebraISBN:9780547587776Author:HOLT MCDOUGALPublisher:HOLT MCDOUGAL
 Glencoe Algebra 1, Student Edition, 9780079039897...AlgebraISBN:9780079039897Author:CarterPublisher:McGraw Hill