
Concept explainers
Videos
Example 3.19 used annual rainfall data for Albuquerque, New Mexico, to construct a relative frequency distribution and cumulative relative frequency plot. The National Climate Data Center also gave the accompanying annual rainfall (in inches) for Medford, Oregon, from 1950 to 2008.
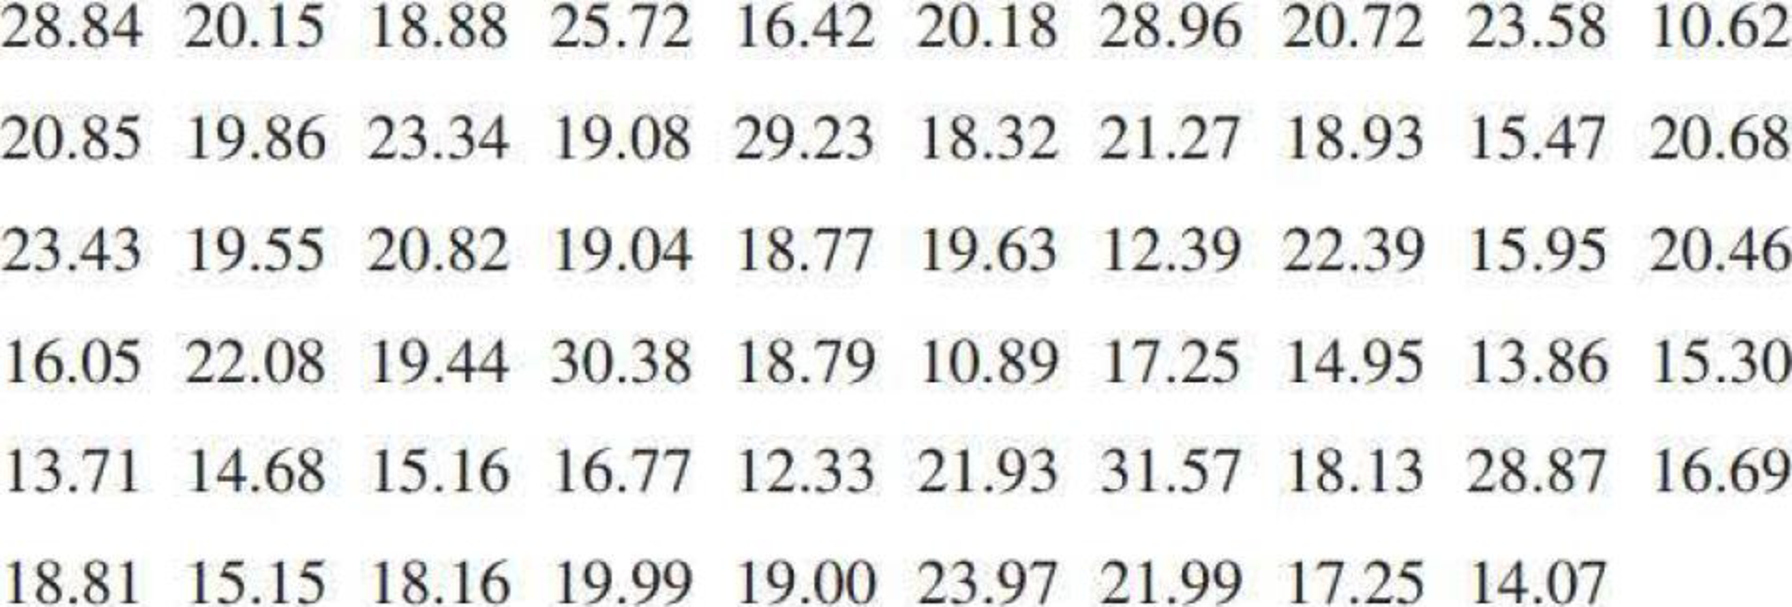
- a. Construct a relative frequency distribution for the Medford rainfall data.
- b. Use the relative frequency distribution of Part (a) to construct a histogram. Describe the shape of the histogram.

Trending nowThis is a popular solution!

Chapter 3 Solutions
Bundle: Introduction to Statistics and Data Analysis, 5th + WebAssign Printed Access Card: Peck/Olsen/Devore. 5th Edition, Single-Term
Additional Math Textbook Solutions
Essentials of Statistics, Books a la Carte Edition (5th Edition)
Elementary Statistics Using the TI-83/84 Plus Calculator, Books a la Carte Edition (4th Edition)
Business Statistics: A First Course (8th Edition)
Essentials of Statistics (6th Edition)
Statistical Techniques in Business and Economics
Research Methods for the Behavioral Sciences (MindTap Course List)


 Big Ideas Math A Bridge To Success Algebra 1: Stu...AlgebraISBN:9781680331141Author:HOUGHTON MIFFLIN HARCOURTPublisher:Houghton Mifflin Harcourt
 Glencoe Algebra 1, Student Edition, 9780079039897...AlgebraISBN:9780079039897Author:CarterPublisher:McGraw Hill
 Holt Mcdougal Larson Pre-algebra: Student Edition...AlgebraISBN:9780547587776Author:HOLT MCDOUGALPublisher:HOLT MCDOUGAL
 Functions and Change: A Modeling Approach to Coll...AlgebraISBN:9781337111348Author:Bruce Crauder, Benny Evans, Alan NoellPublisher:Cengage Learning