
Concept explainers
Videos
(a)
To find the median, first and third
(a)
Answer to Problem 35E
Median
Explanation of Solution
Given:
The data for Giants’ salaries is given by
| 19.00 | 18.25 | 16.17 | 10.00 | 8.50 |
| 6.00 | 6.00 | 5.00 | 4.85 | 4.25 |
| 3.20 | 3.00 | 2.20 | 1.58 | 1.30 |
| 1.25 | 1.00 | 0.75 | 0.63 | 0.62 |
| 0.56 | 0.48 | 0.48 | 0.48 | 0.48 |
| 0.48 | 0.48 | 0.48 | 0.48 |
Formula used:
First quartile
If
Third quartile
If
Median is given by
Calculation:
Given data sorted in ascending order:
| x |
| 0.48 |
| 0.48 |
| 0.48 |
| 0.48 |
| 0.48 |
| 0.48 |
| 0.48 |
| 0.48 |
| 0.56 |
| 0.62 |
| 0.63 |
| 0.75 |
| 1.00 |
| 1.25 |
| 1.30 |
| 1.58 |
| 2.20 |
| 3.00 |
| 3.20 |
| 4.25 |
| 4.85 |
| 5.00 |
| 6.00 |
| 6.00 |
| 8.50 |
| 10.00 |
| 16.17 |
| 18.25 |
| 19.00 |
Here, n = 29
First need to find First quartile and third quartile
First Quartile:
First quartile is
Third quartile:
Third quartile is
Here
(b)
To find the median, first and third quartiles of the Tigers’ salaries.
(b)
Answer to Problem 35E
Median
Explanation of Solution
Given:
The data for Tigers’ salaries is given by
| 23.00 | 21.00 | 20.10 | 13.00 | 9.00 |
| 6.73 | 5.50 | 5.50 | 5.50 | 3.75 |
| 3.10 | 2.10 | 2.10 | 2.10 | 1.10 |
| 1.00 | 0.90 | 0.51 | 0.51 | 0.50 |
| 0.50 | 0.50 | 0.49 | 0.49 | 0.49 |
| 0.48 | 0.48 | 0.48 | 0.48 |
Formula used:
First quartile
If
Third quartile
If
Median is given by
Calculation:
Given data sorted in ascending order:
| x |
| 0.48 |
| 0.48 |
| 0.48 |
| 0.48 |
| 0.49 |
| 0.49 |
| 0.49 |
| 0.50 |
| 0.50 |
| 0.50 |
| 0.51 |
| 0.51 |
| 0.90 |
| 1.00 |
| 1.10 |
| 2.10 |
| 2.10 |
| 3.00 |
| 3.10 |
| 3.75 |
| 5.50 |
| 5.50 |
| 5.50 |
| 6.73 |
| 9.00 |
| 13.00 |
| 20.10 |
| 21.0 |
| 23.00 |
Here, n = 29
First need to find First quartile and third quartile
First Quartile:
First quartile is
Third quartile:
Third quartile is
Here
(c)
To find upper and lower outlier boundaries of Giants’ salaries.
(c)
Answer to Problem 35E
Lower outlier boundary of Giants’ salaries. is
Upper outlier boundary of Giants’ salaries. is
Explanation of Solution
Given:
From part (a)
Formula used:
IQR: Inter
Calculation:
Therefore,
d)
To find upper and lower outlier boundaries of Tigers’ salaries.
d)
Answer to Problem 35E
Lower outlier boundary of Tigers’ salaries. is
Upper outlier boundary of Tigers’ salaries. is
Explanation of Solution
Given:
From part (b)
Formula used:
IQR: Inter Quartile
Calculation:
Therefore,
(e)
To construct a boxplot for Tigers’ salaries and Giants’ salaries and compare.
(e)
Explanation of Solution
Boxplot from given datafor Tigers’ salaries and Giants’ salaries are constructed below.
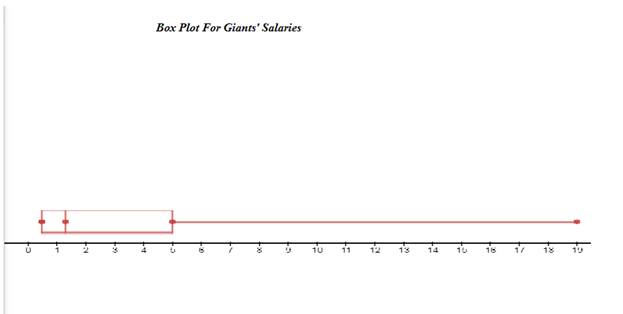
From the above box plot, it can be concluded that 19 is the outlier value which is greater than upper outlier limit.
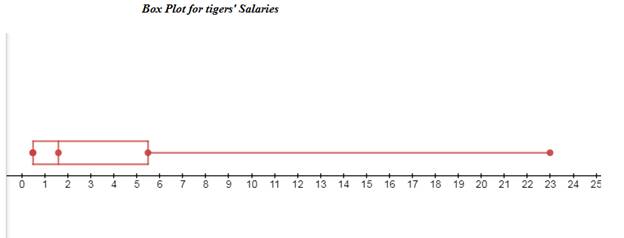
From the above box plot, it can be concluded that 23 is the outlier value which is greater than upper outlier limit.
Want to see more full solutions like this?
Chapter 3 Solutions
Elementary Statistics 2nd Edition


 Glencoe Algebra 1, Student Edition, 9780079039897...AlgebraISBN:9780079039897Author:CarterPublisher:McGraw Hill
 Holt Mcdougal Larson Pre-algebra: Student Edition...AlgebraISBN:9780547587776Author:HOLT MCDOUGALPublisher:HOLT MCDOUGAL