
Concept explainers
Videos
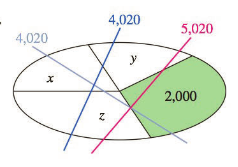
CAT Scans CAT (computerized axial tomographic) scans are used to map the exact location of interior features of the human body. CAT scan technology is based on the following principles: (I) Different components of the human body (water; gray matter; bone, etc.) absorb X-rays to different extents; and (2) to measure the X-ray absorption by a specific region of, say, the brain, it suffices to pass a number of line-shaped pencil beams of X-rays through the brain at different angles and measure the total absorption for each beam, which is the sum of the absorptions of the regions through which it passes. The accompanying diagram illustrates a simple example. (The number in each region shows its absorption, and the number on each X-ray beam shows the total absorption for that beam.)27
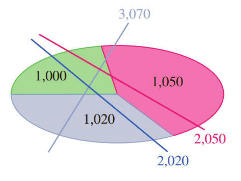
In Exercises 39-44, use the table and the given X-ray absorption diagrams to identity the composition of each of the regions marked by a letter.
| Type | Air | Water | Gray Matter | Tumor | Blood | Bone |
| Absorption | 0 | 1,000 | 1,020 | 1,030 | 1,050 | 2,000 |

Trending nowThis is a popular solution!

Chapter 3 Solutions
Bundle: Finite Mathematics, Loose-leaf Version, 7th + WebAssign Printed Access Card for Waner/Costenoble's Finite Mathematics, 7th Edition, Single-Term


- A team of researchers analyzed the meat from each in a sample of 17 "red snapper" fish fillets purchased from vendors across region in an effort estimate the true proportion of fillets that are really red snapper. DNA tests revealed that 5 of the 17 fillets (or 29%) were not red snapper but the cheaper look-alike variety of fish. Complete parts a through d. a. Identify the parameter of interest to the researchers. The parameter of interest is the of fish fillets that are actually red snapper. b. Explain why a large-sample confidence interval is inappropriate to apply in this study. Choose the correct answer below. OA. It is inappropriate because either the number of successes in the sample or the number of failures in the sample is less than 15. OB. It is inappropriate because the sampling distribution is approximately normal. OC. It is inappropriate because the expected probability of success is 0.29. OD. It is inappropriate because either the number of successes in the sample or the…arrow_forwardWater is poured into a large, cone-shaped cistern. The volume of water, measured in cm, is reported at Which of the following would linearize the data for volume and time? different time intervals, measured in seconds. The scatterplot of volume versus time showed a curved Seconds, cm3 O In(Seconds), cm3 Seconds, In(cm') pattern. O In(Seconds), In(cm³)arrow_forwardA cell phone's SAR (Specific Absorption Rate) is a measure of the amount of radio frequency (RF) energy absorbed by the body when using a cell phone. The rate can vary by the distance of the phone from the ear. Below is a table showing SAR (y) and distance (x) for a sample of five 10 minute calls. Relationship between distance and SAR Distance (cm) SAR level 1.0 46 1.6 41 1.8 42 2.2 30 2.4 31 The slope of the least squares line is 59.6. The intercept is -12. Compute the "total variation" (SST).arrow_forward
- The determination of the shear strength of spot welds is relatively difficult, whereas measuring the weld diameter of spot welds is relatively simple. As a result, it would be advantageous if shear strength could be predicted from a measurement of weld diameter. The data are as follows: Shear strength (psi) Weld diameter (0.0001 in) 370 400 780 800 1210 1250 1560 1600 1980 2000 2450 2500 3070 3100 3550 3600 3940 4000 3950 4000 a) Test the hypothesis that the slope of the regression line is equal to 1 at the 0.05 level of significance.arrow_forwardThe time of arrival of an artificial seismic wave versus the distance from the source is given in the following table. Distance (m.) Time (sec.) 530 0.349 600 0.391 670 0.441 1130 0.739 1200 0.787 1270 0.831 1800 1.160 1870 1.177 1940 1.192 2730 1.377 Choose an appropriate chart and produce a graph of this data.arrow_forwardOphthalmology Retinitis pigmentosa (RP) is a hereditary ocular disease in which patches of pigment appear on the retina, potentially resulting in substantial vision loss and in some cases complete blindness. An important issue is how fast the subjects decline. Visual field is an important measure of area of vision, which is measured in degree2. A visual field area for a normal person is around 11,000 degree2. The longitudinal data in Table 11.29 were provided by an individual patient. tablE 11.29 Longitudinal visual field data for one RP patient Time Visual field area ln Visit (yr) (degree2) (visual field area) 1 0 3059 8.03 2 1 3053 8.02 3 2 1418 7.26 4 3 1692 7.43 5 4 1978 7.59 6 5 1567 7.36 7 6 1919 7.56 8 7 1998 7.60 9 11 1648 7.41 10 13 1721 7.45 11 15 1264 7.14 mean 6.09 1938 7.532 sd 4.97 597 0.280 Suppose the rate of change of ln (visual field) is a linear function of follow-up time. 11.103 Write down a linear regression model that summarizes…arrow_forward
- Help me please I beg youarrow_forwardConstruct a frequency distribution and a relative frequency histogram for the accompanying data set using five classes. Which class has the greatest relative freque and which has the least relative frequency? Click the icon to view the data set. Class Frequency, f Relative frequency Σ- %D (Type integers or decimals. Round the class limits to the nearest whole number. Round all other values to the nearest thousandth as needed.) Choose the correct relative frequency histogram below. O A. В. D. 0.6- 0.6- 0.6- 0.6- 0.4- 0.4- 0.4- 0.4- 0.2- 0.2- 0.2- 0.2- 0- 170 300 430 Tri. Levels 170 300 430 170 300 430 170 300 430 Tri. Levels Tri. Levels Tri. Levels Class - has the greatest relative frequency and class - has the least relative frequency. Click to select vour answer(s). Rel. Frequency Rel. Frequencyarrow_forwardPlease check my work:arrow_forward
- Describe and compare the measurement of the central tendency and thedispersion of the electric usage before and after implementing the newelectric meter based on the histogram and box plots given.arrow_forwardOcean currents are important in studies of climate change, as well as ecology studies of dispersal of plankton. Drift bottles are used to study ocean currents in the Pacific near Hawaii, the Solomon Islands, New Guinea, and other islands. Let x represent the number of days to recovery of a drift bottle after release and y represent the distance from point of release to point of recovery in km/100. The following data are representative of one study using drift bottles to study ocean currents. x days y km/100 74 75 34 92 203 14.9 19.5 5.4 11.9 35.8 (a) Verify that Ex = 478, Ey = 87.5, Ex2 - 61,930, Ey? = 2054.67, Exy = 11110.9, and r- 0.94201. Ex £y Ex? Ey²[ Exy (b) Use a 1% level of significance to test the claim p > 0. (Use 2 decimal places.) critical t Conclusion O Reject the null hypothesis, there is sufficient evidence that p > 0. O Reject the null hypothesis, there is insufficient evidence that p > 0. Fail to reject the null hypothesis, there is insufficient evidence that p > 0.…arrow_forwardOcean currents are important in studies of climate change, as well as ecology studies of dispersal of plankton. Drift bottles are used to study ocean currents in the Pacific near Hawaii, the Solomon Islands, New Guinea, and other islands. Let x represent the number of days to recovery of a drift bottle after release and y represent the distance from point of release to point of recovery in km/100. The following data are representative of one study using drift bottles to study ocean currents. x days y km/100 71 76 31 92 203 14.2 19.6 5.8 11.2 35.9 (a) Verify that Ex = 473, Ey = 86.7, Ex² = 61,451, Ey? 2033.69, Exy = 10995.7, and r 0.93868. %3D %3D %3D %3D %3D Σχ Ey Ex? Ey2 Σχy (b) Use a 1% level of significance to test the claim p > 0. (Use 2 decimal places.) critical t Conclusion Reject the null hypothesis, there is sufficient evidence that p > 0. Reject the null hypothesis, there is insufficient evidence that p > 0. O Fail to reject the null hypothesis, there is insufficient evidence…arrow_forward
 Discrete Mathematics and Its Applications ( 8th I...MathISBN:9781259676512Author:Kenneth H RosenPublisher:McGraw-Hill Education
 Mathematics for Elementary Teachers with Activiti...MathISBN:9780134392790Author:Beckmann, SybillaPublisher:PEARSON
 Thinking Mathematically (7th Edition)MathISBN:9780134683713Author:Robert F. BlitzerPublisher:PEARSON
 Discrete Mathematics With ApplicationsMathISBN:9781337694193Author:EPP, Susanna S.Publisher:Cengage Learning,
 Pathways To Math Literacy (looseleaf)MathISBN:9781259985607Author:David Sobecki Professor, Brian A. MercerPublisher:McGraw-Hill Education