
Concept explainers
Videos
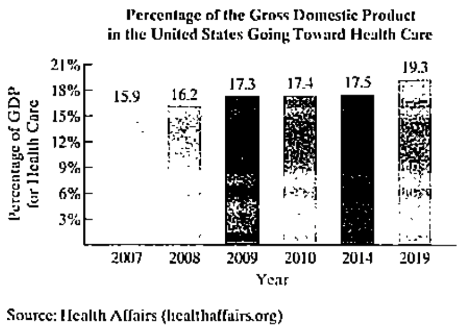
By 2019, nearly S1 out of every S5 spent in the U.S. economy is projected to go for health care. The bar graph shows the percentage of the U.S. gross domestic product (GDP) going toward health care from 2007 through 2014, with a projection for 2019.
The data can he modeled by the function
a. Use the function to determine the percentage of the U.S. gross domestic product that went toward health care in 2008, Round to the nearest tenth of a percent. Does this underestimate or overestimate the percent displayed by the graph? By how much?
b. According to the model, when will 18.6% of the U.S. gross domestic product go toward health care? Round to the nearest year.
Want to see the full answer?
Check out a sample textbook solution
Chapter 3 Solutions
Precalculus with Integrated Review, Books a la Carte Edition, plus MyLab Math with Pearson eText -- Access Card Package (6th Edition)


 Linear Algebra: A Modern IntroductionAlgebraISBN:9781285463247Author:David PoolePublisher:Cengage Learning
 Algebra & Trigonometry with Analytic GeometryAlgebraISBN:9781133382119Author:SwokowskiPublisher:Cengage