
Concept explainers
Videos
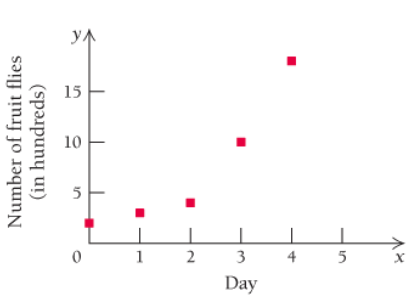
For each of the
a. Quadratic:
b. Polynomial, not quadratic
c. Exponential:
d. Exponential:
e. Logarithmic:
f. Logistic:
Want to see the full answer?
Check out a sample textbook solution
Chapter 3 Solutions
Calculus and Its Applications (11th Edition)
Additional Math Textbook Solutions
Glencoe Math Accelerated, Student Edition
Calculus & Its Applications (14th Edition)
University Calculus: Early Transcendentals (4th Edition)
Precalculus: Concepts Through Functions, A Unit Circle Approach to Trigonometry (4th Edition)
Calculus: Early Transcendentals (3rd Edition)


- The table shows the age-adjusted death rates per 100,000 citizens for heart disease in a certain country. Complete parts(a) through (c) below. Year Death Rate 2000 256.2 2002 239.4 2004 217.0 2006 211.8 2008 184.2 2010 177.1 2012 171.3 2014 165.0 (a) Find an exponential model of the form f(t)=y0b^t for these data, where t=0 corresponds to the year 2000. If you do not have suitable technology, use the first and last data points to find a function. If you have a graphing calculator or other suitable technology, use exponential regression to find a function. f(t)=_ (_)^t (Round to two decimal places as needed.) (b) Assuming the model remains accurate, estimate the death rate in 2020 and 2025. The death rate in 2020 will be:___ people per 100,000. (Round to one decimal place as needed.) The death rate in 2025 will be:___ people per 100,000. (Round to one decimal place as needed.) (c) Use a graphing…arrow_forwardThe table below shows t, the number of thousands of state-registered automatic weapons and p, the number of murders per 100,000 residents for several Northwestern states. t 11.8 8.3 7 3.8 2.5 2.8 2.3 0.5 p 14.1 11.2 10 7.4 6.3 6.1 5.7 4.2 Use your calculator to do a linear regression expressing the number of murders per 100,000 residents as a function of the number of thousands of state-registered automatic weapons. Also, give the rr and r2r2 values from your calculatorRegression Equation: rr = r2 = Round to 3 decimal places.2.Using your linear regression, how many murders per 100,000 residents can be expected in a state with 3100 automatic weapons?Round to 3 decimal places.3.Using your linear regression, how many automatic weapons would be expected in a city with 8.2 murders per 100,000 residents?Round to the nearest whole weapon.arrow_forwardThe CPI (for all urban consumers) for college tuition and fees between 2000 and 2008 for a country is given below. Tuition CPI Year CPI, c 2000 327.9 2001 363.9 2002 377.4 2003 432.5 2004 462.2 2005 490.8 2006 537.2 2007 562.2 2008 586.8 (a) Find the function for the linear model that gives the CPI (for all urban consumers) for college tuition and fees, where t is the number of years after 2000, with data from 0 ≤ t ≤ 8. Round the coefficients of the equation to two decimal places. c(t) = 323.36+33.99t (b) Use the algebraic method to develop a formula for the derivative of the rounded model. c'(t) = per year(c) Evaluate the rate of change of the function in part (a) for the year 2008. (Round your answer to two decimal places.)Interpret the result. In 2008, the CPI for college tuition and fees was ---Select--- increasing decreasing by per year. (d) Calculate the percentage rate of change in the CPI in 2008. (Round your answer to three…arrow_forward
- The following table shows the number, in millions, of women employed outside the home in the given year. Year Numberin millions 1942 16.11 1943 18.70 1944 19.17 1945 19.03 1946 16.78 (a) Use regression to find a quadratic model for the data. (Let t be the number of years since 1942. Round the regression parameters to three decimal places.) (b) Express using functional notation the number of women working outside the home in 1948, and then estimate that value. (Round your answer to two decimal places.)arrow_forwardUse this data and develop a model of a truck's annual maintenance expenses based on its weekly usage in hours. SSR = ? (Keep one decimal place) Weekly Usage (hours) Annual Maintenance Expense 13 17.0 10 22.0 20 30.0 28 37.0 32 47.0 17 30.5 24 32.5 31 39.0 40 51.5 38 40.0arrow_forwardThe following data on x=frying time and y=moisture content of tortilla chips X 5 10 15 20 25 30 45 50 Y 16.3 9.7 8.1 4.2 3.4 2.9 1.9 1.3 Construct the scatterplot and consider if these data form a linear relationship The following data is the log transformation of the above data X’ 0.70 1.00 1.18 1.30 1.40 1.48 1.65 1.78 Y’ 1.21 0.99 0.91 0.62 0.53 0.46 0.28 0.11 Construct a second scatterplot. Do these transformed data appear to have a better linear relationship?arrow_forward
- Consider the following data in the table x y -1 3 0 6 1 12 2 24 Find the function that creates the data above. If linear, express your answer in the form y=mx+b If exponential, express your answer in the form y=a(b)^xarrow_forwardThe following table shows the number, in millions, of women employed outside the home in the given year. Year Numberin millions 1942 16.11 1943 18.70 1944 19.17 1945 19.03 1946 16.78 (a) Use regression to find a quadratic model for the data. (Let t be the number of years since 1942. Round the regression parameters to three decimal places.) (b) Express using functional notation the number of women working outside the home in 1947, and then estimate that value. (Round your answer to two decimal places.) N( ? ) = ? millionarrow_forward
 Algebra & Trigonometry with Analytic GeometryAlgebraISBN:9781133382119Author:SwokowskiPublisher:Cengage