
EBK STATISTICS FOR BUSINESS & ECONOMICS
12th Edition
ISBN: 9780100460461
Author: Anderson
Publisher: YUZU
expand_more
expand_more
format_list_bulleted
Videos
Textbook Question
Chapter 3.4, Problem 52E
Consumer Reports provided overall customer satisfaction scores for AT&T, Sprint, T-Mobile, and Verizon cell-phone services in major metropolitan areas throughout the United States. The rating for each service reflects the overall customer satisfaction considering a variety of factors such as cost, connectivity problems, dropped calls, static interference, and customer support. A satisfaction scale from 0 to 100 was used with 0 indicating completely dissatisfied and 100 indicating completely satisfied. The ratings for the four cell-phone services in 20 metropolitan areas are as shown (Consumer Reports, January 2009).
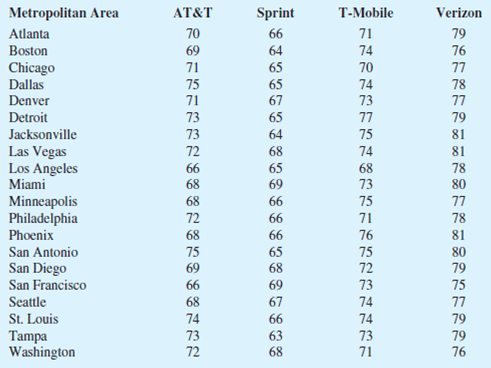
- a. Consider T-Mobile first. What is the
median rating? - b. Develop a five-number summary for the T-Mobile service.
- c. Are there outliers for T-Mobile? explain.
- d. Repeat parts (b) and (c) for the other three cell-phone services.
- e. Show the box plots for the four cell-phone services on one graph. Discuss what a comparison of the box plots tells about the four services. Which service did Consumer Reports recommend as being best in terms of overall customer satisfaction?
Expert Solution & Answer

Trending nowThis is a popular solution!

Students have asked these similar questions
No, the data do not contain outliers. V
d. Repeat parts (b) and (c) for the other three cell phone services.
Smallest value
First quartile (to 2 decimals)
Median (to 1 decimal)
Third quartile (to 2 decimals)
AT&T
Largest value
Are there outliers for AT&T? Explain.
Limits for AT&T(to 1 decimal)
No, the data do not contain outliers.
Are there outliers for Sprint? Explain.
Limits for Sprint(to 2 decimals)
No, the data do not contain outliers. V
Are there outliers for Verizon? Explain.
Limits for Verizon (to 2 decimals)
>
* *
and
Sprint
and
and
-------
X
No, the data do not contain outliers. V
e. Which of the following boxplots accurately displays the data set?
#2
Verizon
x
xx
Consumers reports provided overall customer satisfaction scores for AT&T, Sprint, T-Mobile, and Verizon cell phone services in major metropolitan areas throughout the United States. The rating for each service reflects the overall customer satisfaction considering variety of factors such as cost, connectivity problems, dropped calls, static interference, and customer support. A satisfaction scale from 0 to 100 was used with 0 indicating completely dissatisfied and 100 indicating completely satisfied. The ratings for the four cell phone services is 20 metropolitan areas are as shown. Show steps in Excel please. Only Do D and E
a
Consider T-Mobile first. What is the median rating?
b.
Develop a five-number summary for T-Mobile service.
c
Are there outliers for T-Mobile? Explain
d
Repeat parts b and c for the other three cell phone services.
e
Show the box plots for the four cell phone services on one graph. Discuss what a comparison of the box…
As the leader of the sales team, you would like to increase the revenue brought by your team. You discovered a program for sales personnel that supposedly improve interpersonal skills and thus help settle deals with customers more often. You decide to send8 of your sales people for the training, and compare the amount they brought in sales in the month before they went and in the month after they received the training. The data are:
Xbefore: 400, 300, 1200, 2100, 700, 450, 650, 3400
Xafter: 1000, 400, 1000, 2500, 1200, 600, 800, 3000
A. Identify the appropriate statistical measure to use.
B. Conduct the test. Make a decision about the null hypothesis, interpret your results and calculate effect size if applicable. At ?=.05, can you report to upper management that the training worked? Or was it a waste of money?
C. Calculate 95% confidence intervals for the estimate of the difference.
Chapter 3 Solutions
EBK STATISTICS FOR BUSINESS & ECONOMICS
Ch. 3.1 - Consider a sample with data values of 10, 20, 12,...Ch. 3.1 - Consider a sample with data values of 10, 20, 21,...Ch. 3.1 - Consider the following data and corresponding...Ch. 3.1 - Consider the following data. Period Rate of Return...Ch. 3.1 - Consider a sample with data values of 27, 25, 20,...Ch. 3.1 - Consider a sample with data values of 53, 55, 70,...Ch. 3.1 - The average number of minutes Americans commute to...Ch. 3.1 - During the 2007-2008 NCAA college basketball...Ch. 3.1 - Endowment income is a critical part of the annual...Ch. 3.1 - The cost of consumer purchases such as...
Ch. 3.1 - According to the National Education Association...Ch. 3.1 - The Big Bang Theory, a situation comedy featuring...Ch. 3.1 - In automobile mileage and gasoline-consumption...Ch. 3.1 - The data contained in the file named StateUnemp...Ch. 3.1 - Martinez Auto Supplies has retail stores located...Ch. 3.1 - The grade point average for college students is...Ch. 3.1 - The following table shows the total return and the...Ch. 3.1 - Based on a survey of masters programs in business...Ch. 3.1 - Annual revenue for Corning Supplies grew by 5.5%...Ch. 3.1 - Suppose that at the beginning of 2004 you invested...Ch. 3.1 - If an asset declines in value from 5000 to 3500...Ch. 3.1 - The current value of a company is 25 million. If...Ch. 3.2 - Consider a sample with data values of 10, 20, 12,...Ch. 3.2 - Consider a sample with data values of 10, 20, 12,...Ch. 3.2 - Consider a sample with data values of 27, 25, 20,...Ch. 3.2 - A bowlers scores for six games were 182, 168, 184,...Ch. 3.2 - The results of a search to find the least...Ch. 3.2 - The Australian Open is the first of the four grand...Ch. 3.2 - The Los Angeles times regularly reports the air...Ch. 3.2 - The following data were used to construct the...Ch. 3.2 - The results of Accounting Principals latest...Ch. 3.2 - Prob. 32ECh. 3.2 - Scores turned in by an amateur golfer at the...Ch. 3.2 - The following times were recorded by the...Ch. 3.3 - Consider a sample with data values of 10, 20, 12,...Ch. 3.3 - Consider a sample with a mean of 500 and a...Ch. 3.3 - Consider a sample with a mean of 30 and a standard...Ch. 3.3 - Suppose the data have a bell-shaped distribution...Ch. 3.3 - The results of a national survey showed that on...Ch. 3.3 - The energy information Administration reported...Ch. 3.3 - The national average for the math portion of the...Ch. 3.3 - Many families in California are using backyard...Ch. 3.3 - Florida Power Light (FPL) Company has enjoyed a...Ch. 3.3 - A sample of 10 NCAA college basketball game scores...Ch. 3.3 - The Associated Press Team Marketing Report listed...Ch. 3.4 - Consider a sample with data values of 27, 25, 20,...Ch. 3.4 - Prob. 47ECh. 3.4 - Prob. 48ECh. 3.4 - A data set has a first quartile of 42 and a third...Ch. 3.4 - Naples, Florida, hosts a half-marathon (13.1-mile...Ch. 3.4 - Annual sales, in millions of dollars, for 21...Ch. 3.4 - Consumer Reports provided overall customer...Ch. 3.4 - The Philadelphia Phillies defeated the Tampa Bay...Ch. 3.4 - A listing of 46 mutual funds and their 12-month...Ch. 3.5 - Five observations taken for two variables follow....Ch. 3.5 - Five observations taken for two variables follow....Ch. 3.5 - Ten major college football bowl games were played...Ch. 3.5 - A department of transportations study on driving...Ch. 3.5 - At the beginning of 2009, the economic downturn...Ch. 3.5 - The Dow Jones Industrial Average (DJIA) and the...Ch. 3.5 - Prob. 61ECh. 3 - The average number of times Americans dine out in...Ch. 3 - The U.S. Census Bureau provides statistics on...Ch. 3 - The average waiting time for a patient at an El...Ch. 3 - The U.S. Department of Education reports that...Ch. 3 - Small business owners often look to payroll...Ch. 3 - Public transportation and the automobile are two...Ch. 3 - The National Association of Realtors reported the...Ch. 3 - Prob. 69SECh. 3 - Travel + Leisure magazine provides an annual list...Ch. 3 - Morningstar tracks the performance of a large...Ch. 3 - Does a major league baseball teams record during...Ch. 3 - The days to maturity for a sample of five money...Ch. 3 - Automobiles traveling on a road with a posted...Ch. 3 - The Panama Railroad Company was established in...Ch. 3 - Pelican Stores Pelican Stores, a division of...Ch. 3 - Motion Picture Industry The motion picture...Ch. 3 - Business Schools of Asia-Pacific The pursuit of a...Ch. 3 - Heavenly Chocolates Website Transactions Heavenly...Ch. 3 - African Elephant Populations Although millions of...
Knowledge Booster


Learn more about
Need a deep-dive on the concept behind this application? Look no further. Learn more about this topic, statistics and related others by exploring similar questions and additional content below.Similar questions
- Arianna Estefan manages Salmon Falls Park, which has two flagship roller coasters, the Flyer and the Destroyer. When Arianna walks around the park during hours of operation, she notices that there are fewer people waiting in line for the Flyer than for the Destroyer. Since both roller coasters have similar capacities and similar run times, both roller coasters should have about the same number of riders. Based on the anecdotal evidence, Arianna claims that the population mean number of riders per hour on the Flyer is less than the population mean number of riders per hour on the Destroyer. Arianna reviews data collected in the past and assumes that the population standard deviation is 48.29 for the Flyer and 51.86 for the Destroyer. Arianna randomly selects hours during which the attendant of each ride counts the number of riders. The sampling occurs over the course of several weeks. The results are provided in the table shown below. Assuming the conditions needed for the hypothesis…arrow_forwardArianna Estefan manages Salmon Falls Park, which has two flagship roller coasters, the Flyer and the Destroyer. When Arianna walks around the park during hours of operation, she notices that there are fewer people waiting in line for the Flyer than for the Destroyer. Since both roller coasters have similar capacities and similar run times, both roller coasters should have about the same number of riders. Based on the anecdotal evidence, Arianna claims that the population mean number of riders per hour on the Flyer is less than the population mean number of riders per hour on the Destroyer. Arianna reviews data collected in the past and assumes that the population standard deviation is 48.29 for the Flyer and 51.86 for the Destroyer. Arianna randomly selects hours during which the attendant of each ride counts the number of riders. The sampling occurs over the course of several weeks. The results are provided in the table shown below. Assuming the conditions needed for the hypothesis…arrow_forwardOn December 17, 2007 baseball writer John Hickey wrote an article for the Seattle P-I about increases to ticket prices for Seattle Mariners games during the 2008 season. The article included a data set that listed the average ticket price for each MLB team, the league in which the team plays (AL or NL), the number of wins during the 2007 season and the cost per win (in dollars). The data for the 16 National League teams are shown below. team league price wins cost/win Arizona Diamondbacks NL 19.68 90 35.40 Atlanta Braves NL 17.07 84 32.89 Chicago Cubs NL 34.30 85 65.33 Cincinnati Reds NL 17.90 72 40.32 Colorado Rockies NL 14.72 90 26.67 Florida Marlins NL 16.70 71 38.13 Houston Astros NL 26.66 73 59.11 Los Angeles Dodgers NL 20.09 82 34.64 Milwaukee Brewers NL 18.11 83 35.37 N.Y. Mets NL 25.28 88 46.56 Philadelphia Phillies NL 26.73 89 48.69 Pittsburgh Pirates NL 17.08 68 40.67 San Diego Padres NL 20.83 89 38.15 San Francisco Giants NL 24.53 71…arrow_forward
- Consumers reports provided overall customer satisfaction scores for AT&T, Sprint, T-Mobile, and Verizon cell phone services in major metropolitan areas throughout the United States. The rating for each service reflects the overall customer satisfaction considering variety of factors such as cost, connectivity problems, dropped calls, static interference, and customer support. A satisfaction scale from 0 to 100 was used with 0 indicating completely dissatisfied and 100 indicating completely satisfied. The ratings for the four cell phone services is 20 metropolitan areas are as shown. Show steps in Excel please a Consider T-Mobile first. What is the median rating? b. Develop a five-number summary for T-Mobile service. c Are there outliers for T-Mobile? Explain d Repeat parts b and c for the other three cell phone services. e Show the box plots for the four cell phone services on one graph. Discuss what a comparison of the box plats tells about the…arrow_forwardOn December 17, 2007 baseball writer John Hickey wrote an article for the Seattle P-I about increases to ticket prices for Seattle Mariners games during the 2008 season. The article included a data set that listed the average ticket price for each MLB team, the league in which the team plays (AL or NL), the number of wins during the 2007 season and the cost per win (in dollars). The data for the 16 National League teams are shown below. league price wins cost/win team Arizona Diamondbacks NL 19.68 90 35.40 Atlanta Braves NL 17.07 84 32.89 Chicago Cubs NL 34.30 85 65.33 cincinnati Reds NL 17.90 72 40.32 Colorado Rockies NL 14.72 90 26.67 Florida Marlins NL 16.70 71 38.13 Houston Astros NL 26.66 73 59.11 Los Angeles Dodgers 20.09 82 34.64 NL Milwaukee Brewers NL 18.11 83 35.37 N.Y. Mets NL 25.28 88 46.56 Philadelphia Phillies 26.73 89 48.69 NL Pittsburgh Pirates NL 17.08 68 40.67 San Diego Padres NL 20.83 89 38.15 San Francisco Giants NL 24.53 71 56.00 St. Louis Cardinals NL 29.78 78…arrow_forwardAn insurance company crashed four cars in succession at 5 miles per hour. The cost of repair for each of the crashes was $421,$465,$412,$218. Compute the range of dataarrow_forward
- The scatterplot shows the theater revenue and rental revenue for each of 24 movies. Also shown is The line of best fit for the dataarrow_forwardA national park conducts a study on the behaviour of their leopards. A few of the park's leopards are registered and receive a GPS device which allows measuring the position of the leopard. Use this example to describe the following concepts: population, sample, observation, value, and variable.arrow_forwardThe average number of minutes Americans commute to work is 27.7 minutes (Sterling's Best Places, April 13, 2012). The average commute time in minutes for 48 cities are as follows: Click on the datafile logo to reference the data. DATA file Albuquerque Atlanta Austin Baltimore Boston Charlotte Chicago Cincinnati Cleveland Columbus Dallas Denver Detroit El Paso Fresno Indianapolis 23.3 28.3 24.6 32.1 31.7 25.8 38.1 24.9 26.8 23.4 28.5 28.1 29.3 24.4 23.0 24.8 Jacksonville Kansas City Las Vegas Little Rock Los Angeles Louisville Memphis Miami Milwaukee Minneapolis Nashville New Orleans New York Oklahoma City Orlando Philadelphia 26.2 Phoenix 23.4 Pittsburgh Portland 28.4 20.1 32.2 21.4 23.8 30.7 24.8 23.6 25.3 31.7 43.8 22.0 27.1 34.2 Providence Richmond c. What is the mode for these 48 cities? Select your answer - Sacramento Salt Lake City San Antonio San Diego San Francisco San Jose Seattle St. Louis Tucson Tulsa Washington, D.C. 28.3 25.0 26.4 23.6 23.4 25.8 20.2 26.1 24.8 32.6 28.5…arrow_forward
arrow_back_ios
arrow_forward_ios
Recommended textbooks for you
 Glencoe Algebra 1, Student Edition, 9780079039897...AlgebraISBN:9780079039897Author:CarterPublisher:McGraw Hill
 Holt Mcdougal Larson Pre-algebra: Student Edition...AlgebraISBN:9780547587776Author:HOLT MCDOUGALPublisher:HOLT MCDOUGAL
 Functions and Change: A Modeling Approach to Coll...AlgebraISBN:9781337111348Author:Bruce Crauder, Benny Evans, Alan NoellPublisher:Cengage Learning
 Big Ideas Math A Bridge To Success Algebra 1: Stu...AlgebraISBN:9781680331141Author:HOUGHTON MIFFLIN HARCOURTPublisher:Houghton Mifflin Harcourt
Glencoe Algebra 1, Student Edition, 9780079039897...
Algebra
ISBN:9780079039897
Author:Carter
Publisher:McGraw Hill
Holt Mcdougal Larson Pre-algebra: Student Edition...
Algebra
ISBN:9780547587776
Author:HOLT MCDOUGAL
Publisher:HOLT MCDOUGAL
Functions and Change: A Modeling Approach to Coll...
Algebra
ISBN:9781337111348
Author:Bruce Crauder, Benny Evans, Alan Noell
Publisher:Cengage Learning
Big Ideas Math A Bridge To Success Algebra 1: Stu...
Algebra
ISBN:9781680331141
Author:HOUGHTON MIFFLIN HARCOURT
Publisher:Houghton Mifflin Harcourt
What Are Research Ethics?; Author: HighSchoolScience101;https://www.youtube.com/watch?v=nX4c3V23DZI;License: Standard YouTube License, CC-BY
What is Ethics in Research - ethics in research (research ethics); Author: Chee-Onn Leong;https://www.youtube.com/watch?v=W8Vk0sXtMGU;License: Standard YouTube License, CC-BY