
Videos
(a)
To fill: The blanks provided for the statement “In the given graph of a function, as

(b)
To fill: The blanks provided for the statement “In the given graph of a function, as

(c)
To fill: The blanks provided for the statement “In the given graph of a function, as
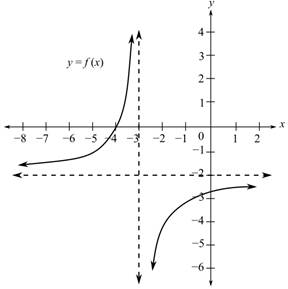
(d)
To fill: The blanks provided for the statement “In the given graph of a function, as

(e)
To fill: The blanks provided for the statement “The given graph of a function is increasing over the interval(s) _____________”
(f)
To fill: The blanks provided for the statement “The given graph of a function is decreasing over the interval(s) _____________”
(g)
To fill: The blanks provided for the statement “In the given graph of a function, the domain is _____________”
(h)
To fill: The blanks provided for the statement “In the given graph of a function, the range is _____________”
(i)
To fill: The blanks provided for the statement “In the given graph of a function, the vertical asymptote is the line _____________”
(j)
To fill: The blanks provided for the statement “In the given graph of a function, the horizontal asymptote is the line _____________”
Want to see the full answer?
Check out a sample textbook solution
Chapter 3 Solutions
College Algebra


- Attached is the graph of the function g(x) = |x| What would the graph of kg(x) when -4 < k < -1 look like?arrow_forwardWhat is the end behavior of the graph of f(x) = – 0.5x2 – 3x – 4? A.as x increases, f(x) increases; as x decreases, f(x) decreases B.as x increases, f(x) decreases; as x decreases, f(x) decreases C.as x increases, f(x) increases; as x decreases, f(x) increases D.as x increases, f(x) decreases; as x decreases, f(x) increasesarrow_forward8. Use the graph of the pieces use function h(x) below to fill in the blanks in the set of function rules for h(x)arrow_forward
- The diagram shows the graph of the function f(x)=Asin(Bx). How do I find the values of a and b?arrow_forwardThe function describes the number of people, f(t), who have become ill with influenza t weeks after its initial outbreak in a town with 30,000 inhabitants. a. How many people became ill with the flu when the epidemic began? b. How many people were ill by the end of the fourth week? c. What is the limiting size of f(t), the population that becomes ill?arrow_forwardWhich of the following statements about the graph of f(x)=(0.5)xf(x)=(0.5)x shown above are true? Select all that apply.arrow_forward
- Suppose that the function y=f(x) is increasing on the interval (2,4). Over what interval is the graph of y=f(x-6) increasing? a. (8,10) b. (12, 24) c. (-4, -2)arrow_forward4. The table below shows the number, in thousands, of vehicles parked in the central business district of a certain city on a typical Friday as a function of the number of hours after 9 AM. hours after 9 AM Number of vehicles parked in thousands 0 6.2 2 7.4 4 7.6 6 6.7 8 4 c. At what time of day does the city have a maximum number of parked cars? d. What is the maximum daily amount of parked cars?arrow_forward1 Use the graph of y=f(x) in the accompanying figure to estimate the value of f′(3).arrow_forward
 Algebra & Trigonometry with Analytic GeometryAlgebraISBN:9781133382119Author:SwokowskiPublisher:Cengage
 Big Ideas Math A Bridge To Success Algebra 1: Stu...AlgebraISBN:9781680331141Author:HOUGHTON MIFFLIN HARCOURTPublisher:Houghton Mifflin Harcourt