
Concept explainers
Videos
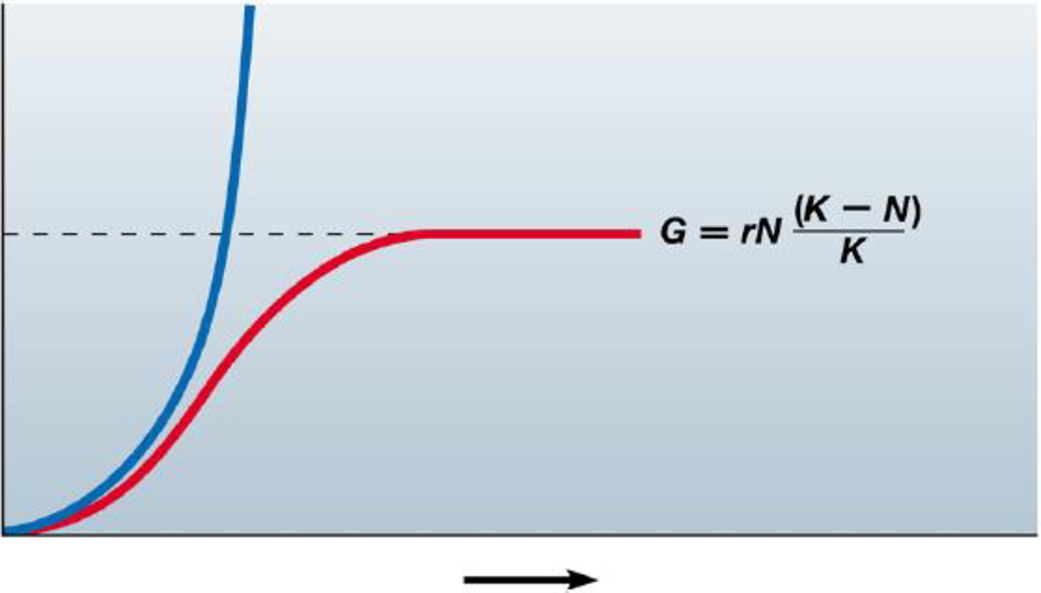
Use this graph of the idealized exponential and
a. Label the axes and curves on the graph.
b. Give the formula that describes the blue curve.
c. What does the dotted line represent?
d. For each curve, indicate and explain where population growth is the most rapid.
e. Which of these curves best represents global human population growth?
a.
To label: The axis and the curves of the graph.
Introduction: Exponential growth curve is the J-shaped curve that is ever increasing in nature. The logistic growth curve is an S shaped curve in which the growth of the population ceases after a certain point which can be represented as the carrying capacity of the population.
Answer to Problem 1CC
Correct answer:
X-axis is time, Y-axis is population size. Blue/thick curve is the exponential growth and red/thin curve is logistic curve
Explanation of Solution
Graphical representation: Fig: 1 shows the graph depicting the logistic and exponential growth curve.
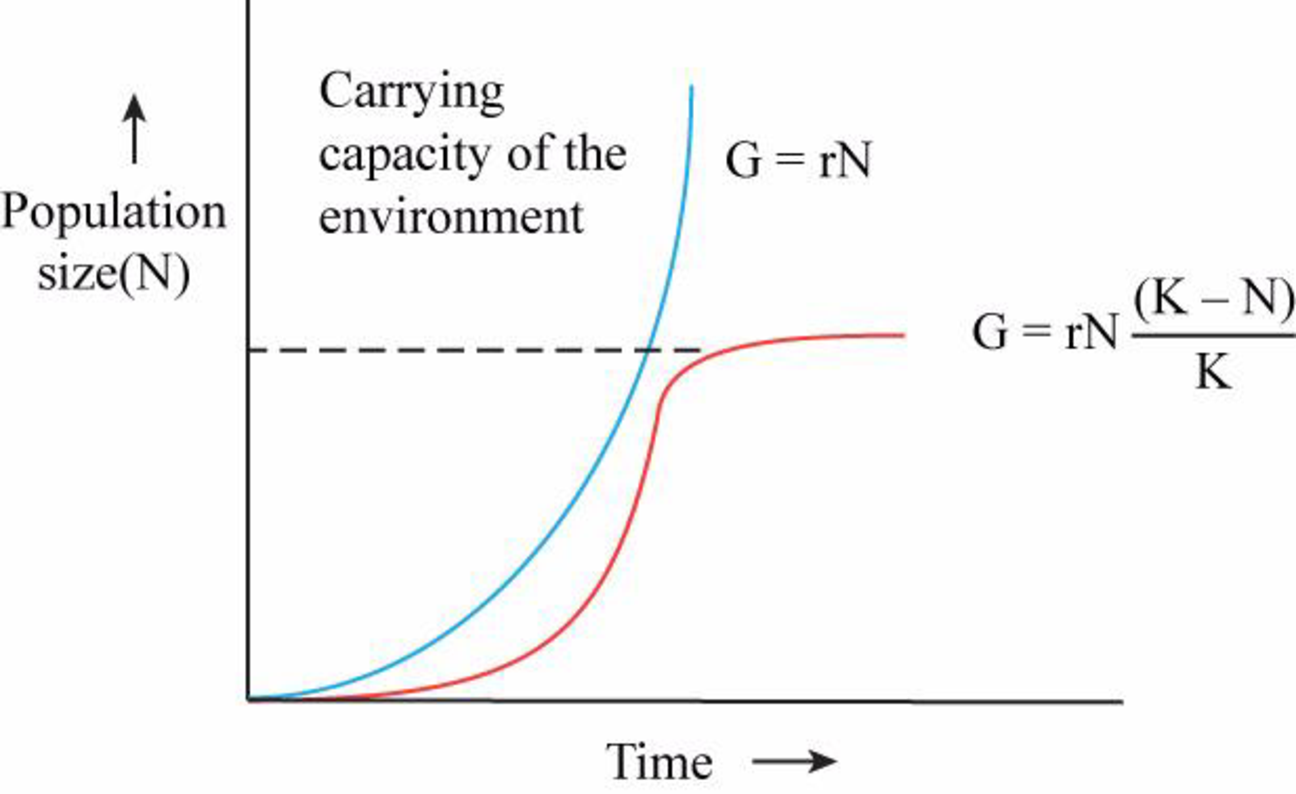
Fig. 1: The graph depicting the logistic and exponential growth curve.
The X-axis of the graph represents the time taken for growth and the Y-axis of the graph represents the size of the population. The blue/thick curve is the exponential growth curve and red/thin curve is logistic growth curve. Hence the correct answer is X-axis is time, Y-axis is population size. Blue/thick curve is the exponential growth and red/thin curve is logistic curve
b.
To give: The formula that describes the blue curve.
Answer to Problem 1CC
Correct answer:
Explanation of Solution
Refer to Fig.1; the blue curve can be described by the formula
c.
To determine: What does the dotted line represents.
Answer to Problem 1CC
Correct answer:
Carrying capacity of the environment (K)
Explanation of Solution
Refer to Fig.1; the dotted line represented on the graph is the carrying capacity of the environment. Hence the correct answer is carrying capacity of the environment (K)
d.
To determine: What does each curve represents.
Answer to Problem 1CC
Correct answer:
Population of logistic curve is most rapid at half of the carrying capacity. Population of exponential growth is most rapid throughout the curve as it is continuously increasing.
Explanation of Solution
Refer to Fig.1; the population growth is most rapid when population attains half of the carrying capacity in logistic curve and the population growth is continuously increasing in the exponential growth curve. Hence the correct answer half of the carrying capacity in logistic curve and continuous growth in exponential growth.
e.
To determine: The curve which represents the global human population.
Answer to Problem 1CC
Correct answer:
Exponential growth curve
Explanation of Solution
Refer to Fig.1; it is the J shaped curve that is continuously increasing is the exponential growth curve. The worldwide population can be represented by this curve as the population is ever increasing. Hence the correct answer is exponential growth curve.
Want to see more full solutions like this?
Chapter 36 Solutions
CAMPBELL BIOLOGY:CONCEPTS..W/JUNGLE>IC


- A population that did not grow in close relation to the amount of resources available in the environment, and dramatically overshot the carrying capacity, would experience: A. logistic growth, such as shown on the S-shaped curve B. exponential growth, such as shown on the J-shaped curve C. unpredictable growth, such as shown on the ?-shaped curve D. exponential growth, such as shown on the S-shaped curve E.logistic growth, such as shown on the J-shaped curvearrow_forwardExamine the top and middle graphs in Figure 54-5. Are these examples of exponential or logistic population growth? Where is K in each graph?arrow_forwarda) The region numbered 3 on the graph represents the __A__ brought on by the limiting factors called __B___. Select one: a. A B Carrying capacity Environmental resistance b. A B Environmental resistance Exponential growth c. A B Exponential growth Lag phase d. A B Lag phase Carrying capacity b) The region of the graph that illustrates the exponential growth of a population and the type of graph illustrated are, respectively: Select one: a. Exponential Growth Type of Graph 4 S-shaped b. Exponential Growth Type of Graph 2 Logistic c. Exponential Growth Type of Graph 3 J-Shaped d. Exponential Growth Type of Graph 1 Exponential c) What do the regions numbered 2 and 4 on the graph represent? Select one: a. Region #2 Region #4 Immigration and birth rate is less than emigration and death rate. Emigration and death rate is less than immigration and birth rate. b. Region #2…arrow_forward
- The type of growth that occurs in a population that grows by a constant percentage per year is________ . Does this form of growth add the same number of individuals each year?_______ What shape of curve is generated if this type of growth is graphed?______ Can this type of growth be sustained indefinitely?______arrow_forwardThe island of Isle Royale in Lake Superior has historically contained both moose and wolves. In recent years, the number of wolves has dwindled, leaving few predators for the moose. This has led to a large increase in the moose population on the island. The following information is from 2018. Using this information and the equation shown, the growth rate for the moose population on Isle Royale can be calculated. Based on the current population and the growth rate, what type of growth model would be expected? A - A logistical growth model would best represent this population because the moose population will decrease over time. B - An exponential growth model would best represent this population because there are few predators for the moose on this island. C - A logistical growth model would best represent this population because the increase in the number of moose would level off over time. D - An exponential growth model would best represent this population because the moose…arrow_forwardIn the development of the exponential model of population growth, why can B and D be substituted by bN and dN, respectively? Explain.arrow_forward
- Explain the difference between logistic and exponential population growth. What do these growth curves look like. Which represents human population growth over the last few thousand years?arrow_forwardHow does the logistic growth model of population growth differ from the exponential growth model? A. The graph of the exponential model is S-shaped. B. The logistic growth model shows an unrestricted growth rate. C. The logistic growth model considers the environment's carrying capacity. D. The exponential growth model shows a restricted growth rate.arrow_forwardContrast exponential and logistic (= sigmoid) growth of a population. Under what conditions might you expect a population to exhibit ex-ponential growth? Why can exponential growth not be perpetuated indefinitely?arrow_forward
- Explain the differences between equations for exponential population growth, logistic population growth, and Lotka-Volterra models for competition. Illustrate how and explain why these equations yield different trends?arrow_forwardWhy does the exponential model of population growth produce a curve shaped like a J?arrow_forwardOut of the two population growth models, which one is more realistic & Why?arrow_forward
 Biology (MindTap Course List)BiologyISBN:9781337392938Author:Eldra Solomon, Charles Martin, Diana W. Martin, Linda R. BergPublisher:Cengage Learning