Videos
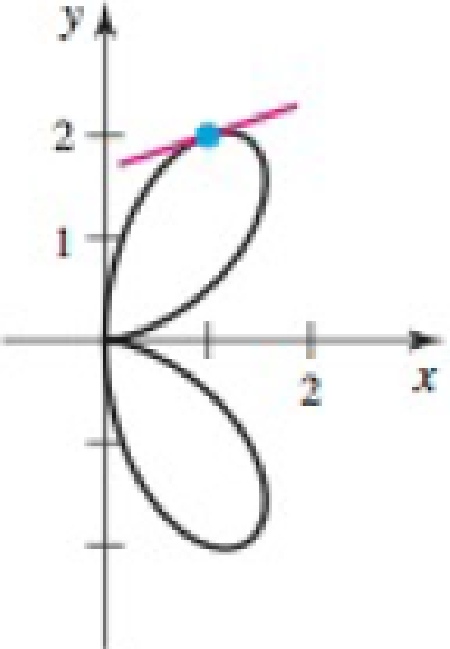
Normal lines A normal line at a point P on a curve passes through P and is perpendicular to the line tangent to the curve at P (see figure). Use the following equations and graphs to determine an equation of the normal line at the given point. Illustrate your work by graphing the curve with the normal line.
70. Exercise 30
30.
Want to see the full answer?
Check out a sample textbook solution
Chapter 3 Solutions
Calculus: Early Transcendentals, Books a la Carte Plus MyLab Math/MyLab Statistics Student Access Kit (2nd Edition)
Additional Math Textbook Solutions
Glencoe Math Accelerated, Student Edition
Thomas' Calculus: Early Transcendentals (14th Edition)
Calculus and Its Applications (11th Edition)
University Calculus: Early Transcendentals (4th Edition)


- When Date Are Unevenly speed. If data are evenly spaced, we need only calculate differences to see whether the data are linear. But if data not evenly spaced, then we must calculate the average rate of change over each interval to see whether the data are linear. If the average rate of changes is constant, it is the slope of the linear function. This fact is used in Exercises 23 and 24. In the following table, show that the average rate of change is the same over each interval. This shows the data are linear, even though the differences in y are not constant. Then find a linear model for the data. x 1 2 5 6 y 7 10 19 22arrow_forwardWhen Date Are Unevenly speed. If data are evenly spaced, we need only calculate differences to see whether the data are linear. But if data are not evenly spaced, then we must calculate the average rate of change over each interval to see whether the data are linear. If the average rate of change is constant, it is the slope of the linear function. This fact is used in Exercises 23 and 24. In the following table, show that the average rate of change from 2 to 5 is not the same as the average rate of change from 5 to 6. This shows that the data are not linear, even though the differences in y are constant. x 1 2 5 6 y 3 6 9 12arrow_forwardExam Scores The table shows the mathematics entrance test scores x and the final examination scores y in an algebra course for a sample of 10 students. (a) Sketch a scatter plot of the data. (b) Find the entrance test score of any student with a final exam score in the 80s. (c) Does a higher entrance test score imply a higher final exam score? Explain.arrow_forward
 Glencoe Algebra 1, Student Edition, 9780079039897...AlgebraISBN:9780079039897Author:CarterPublisher:McGraw Hill
 Trigonometry (MindTap Course List)TrigonometryISBN:9781337278461Author:Ron LarsonPublisher:Cengage Learning
 Holt Mcdougal Larson Pre-algebra: Student Edition...AlgebraISBN:9780547587776Author:HOLT MCDOUGALPublisher:HOLT MCDOUGAL
 Big Ideas Math A Bridge To Success Algebra 1: Stu...AlgebraISBN:9781680331141Author:HOUGHTON MIFFLIN HARCOURTPublisher:Houghton Mifflin Harcourt
 Functions and Change: A Modeling Approach to Coll...AlgebraISBN:9781337111348Author:Bruce Crauder, Benny Evans, Alan NoellPublisher:Cengage Learning