Videos
Logistic growth Scientists often use the logistic growth function
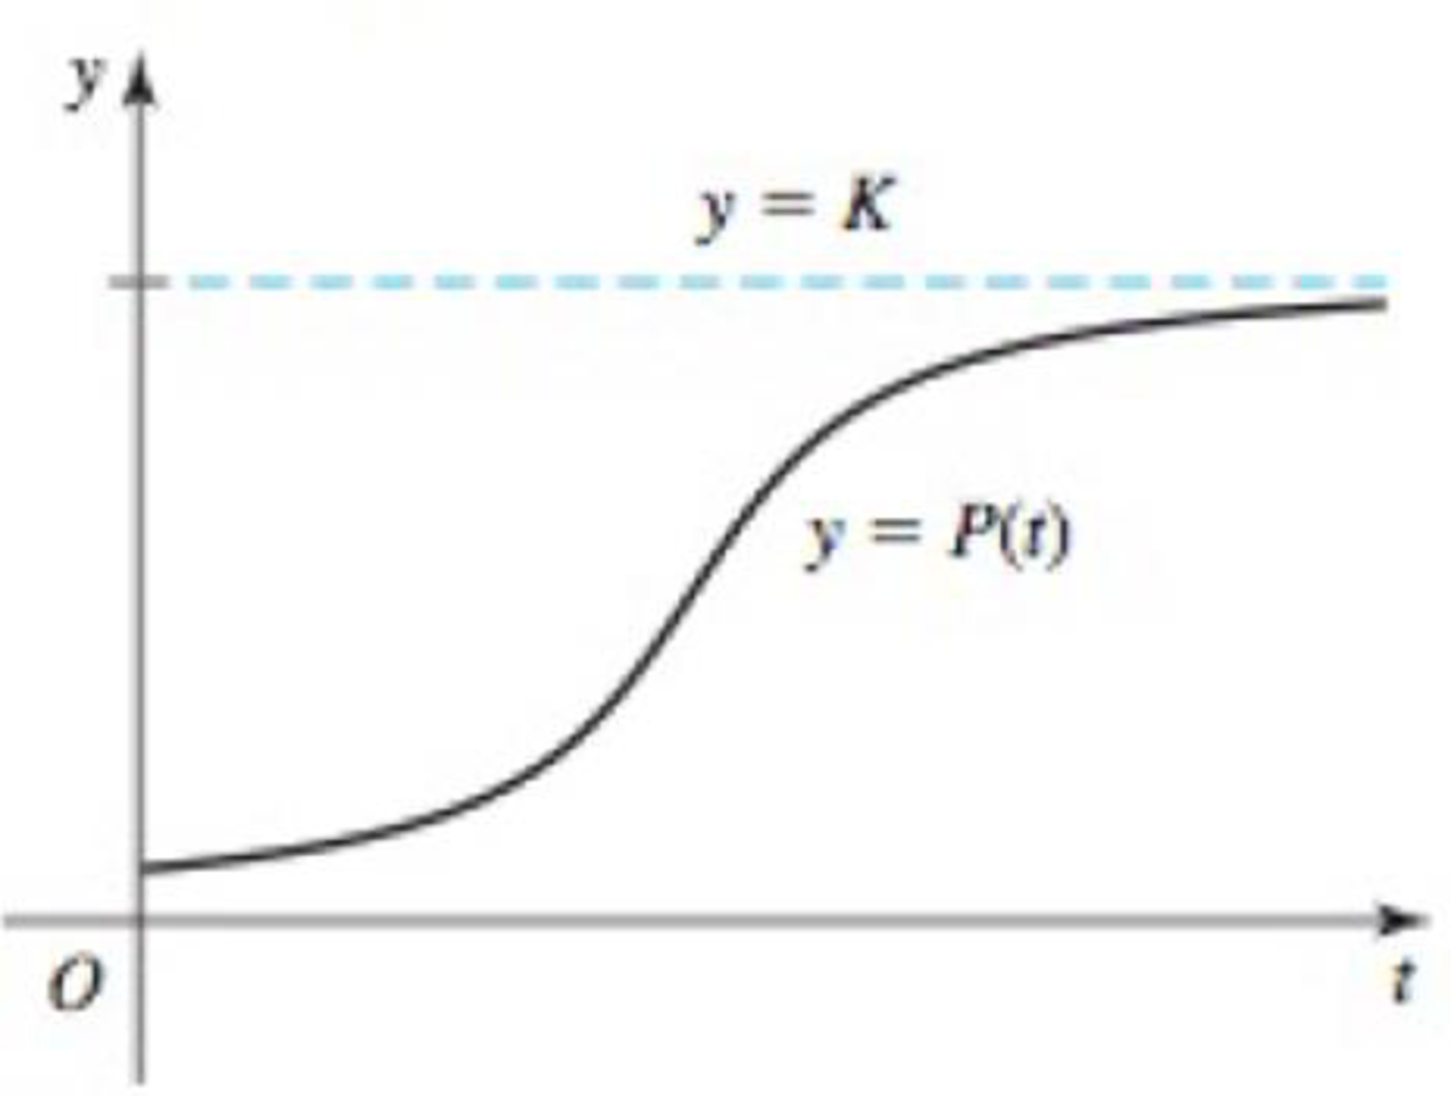
93. Gone fishing When a reservoir is created by a new dam, 50 fish are introduced into the reservoir, which has an estimated carrying capacity of 8000 fish. A logistic model of the fish population is
- a. Graph P using a graphing utility. Experiment with different windows until you produce an S-shaped curve characteristic of the logistic model. What window works well for this function?
- b. How long does it take the population to reach 5000 fish? How long does it take the population to reach 90% of the carrying capacity?
- c. How fast (in fish per year) is the population growing at t = 0? At t = 5?
- d. Graph P’ and use the graph to estimate the year in which the population is growing fastest.
Want to see the full answer?
Check out a sample textbook solution
Chapter 3 Solutions
Calculus: Early Transcendentals, Books a la Carte, and MyLab Math with Pearson eText -- Title-Specific Access Card Package (3rd Edition)
Additional Math Textbook Solutions
Glencoe Math Accelerated, Student Edition
University Calculus: Early Transcendentals (3rd Edition)
Precalculus (10th Edition)
Precalculus
Precalculus Enhanced with Graphing Utilities (7th Edition)
University Calculus: Early Transcendentals (4th Edition)


- Decay of Litter Litter such as leaves falls to the forest floor, where the action of insects and bacteria initiates the decay process. Let A be the amount of litter present, in grams per square meter, as a function of time t in years. If the litter falls at a constant rate of L grams per square meter per year, and if it decays at a constant proportional rate of k per year, then the limiting value of A is R=L/k. For this exercise and the next, we suppose that at time t=0, the forest floor is clear of litter. a. If D is the difference between the limiting value and A, so that D=RA, then D is an exponential function of time. Find the initial value of D in terms of R. b. The yearly decay factor for D is ek. Find a formula for D in term of R and k. Reminder:(ab)c=abc. c. Explain why A=RRekt.arrow_forwardLogistic Growth Animal populations are not capable of unrestricted growth because of limited habitat and food supplies. Under such conditions the population follows a logistic growth model: p(t)=d1+kea Where c, d, and k are positive constants. For a certain fish population in a small pond d=1200, k=11, c=0.2, and t is measured in years. The fish were introduced into the pond at time t=0 . How many fish were originally put in the pond? Find the population after 10, 20, and 30 years. Evaluate p(t) for large values of t. What value does the population approach as t? Does the graph shown confirm your calculations?arrow_forwardEastern Pacific Yellowfin Tuna Studies to fit a logistic model to the Eastern Pacific yellowfin tuna population have yielded N=1481+36e2.61t where t is measured in years and N is measured in thousands of tons of fish. a. What is the r value for the Eastern Pacific yellowfin tuna? b. What is the carrying capacity K for the Eastern Pacific yellowfin tuna? c. What is the optimum yield level? d. Use your calculator to graph N versus t. e. At what time was the population growing the most rapidly?arrow_forward
 Functions and Change: A Modeling Approach to Coll...AlgebraISBN:9781337111348Author:Bruce Crauder, Benny Evans, Alan NoellPublisher:Cengage Learning
 College AlgebraAlgebraISBN:9781305115545Author:James Stewart, Lothar Redlin, Saleem WatsonPublisher:Cengage Learning
 Glencoe Algebra 1, Student Edition, 9780079039897...AlgebraISBN:9780079039897Author:CarterPublisher:McGraw Hill
 Algebra & Trigonometry with Analytic GeometryAlgebraISBN:9781133382119Author:SwokowskiPublisher:Cengage