
Videos
For its first 2 decades of existence, the NBA’s Orlando Magic basketball team set seat prices for its 41-game home
But when Anthony Perez, director of business strategy, finished his MBA at the University of Florida, he developed a valuable database of ticket sales. Analysis of the data led him to build a
Studying individual sales of Magic tickets on the open Stub Hub marketplace during the prior season, Perez determined the additional potential sales revenue the Magic could have made had they charged prices the fans had proven they were willing to pay on Stub Hub. This became his dependent variable, y, in a multiple-regression model.
He also found that three variables would help him build the “true market” seat price for every game. With his model, it was possible that the same seat in the arena would have as many as seven different prices created at season onset—sometimes higher than expected on average and sometimes lower.
The major factors he found to be statistically significant in determining how high the demand for a game ticket, and hence, its price, would be were:
► The day of the week (x1)
► A rating of how popular the opponent was (x2)
► The time of the year (x3)
For the day of the week, Perez found that Mondays were the least-favored game days (and he assigned them a value of 1). The rest of the weekdays increased in popularity, up to a Saturday game, which he rated a 6. Sundays and Fridays received 5 ratings, and holidays a 3 (refer to the footnote in Table 4.2).

Fernado Medina
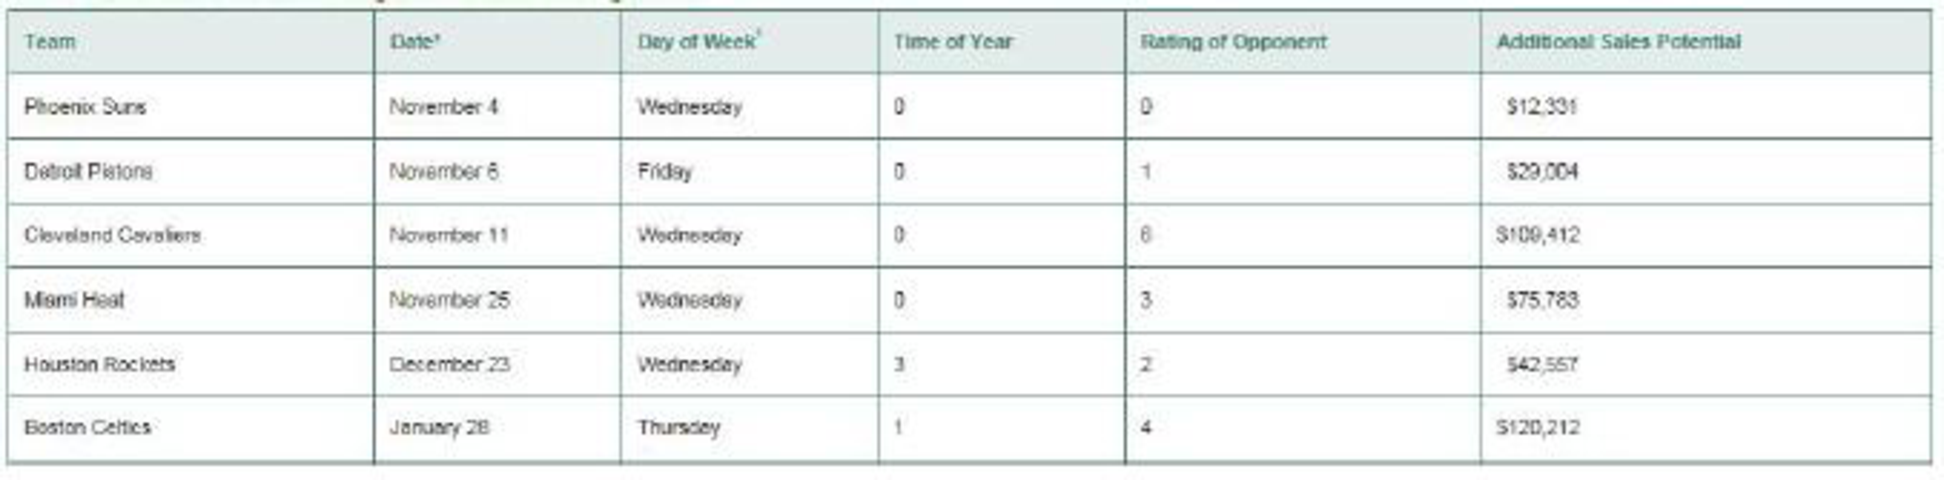
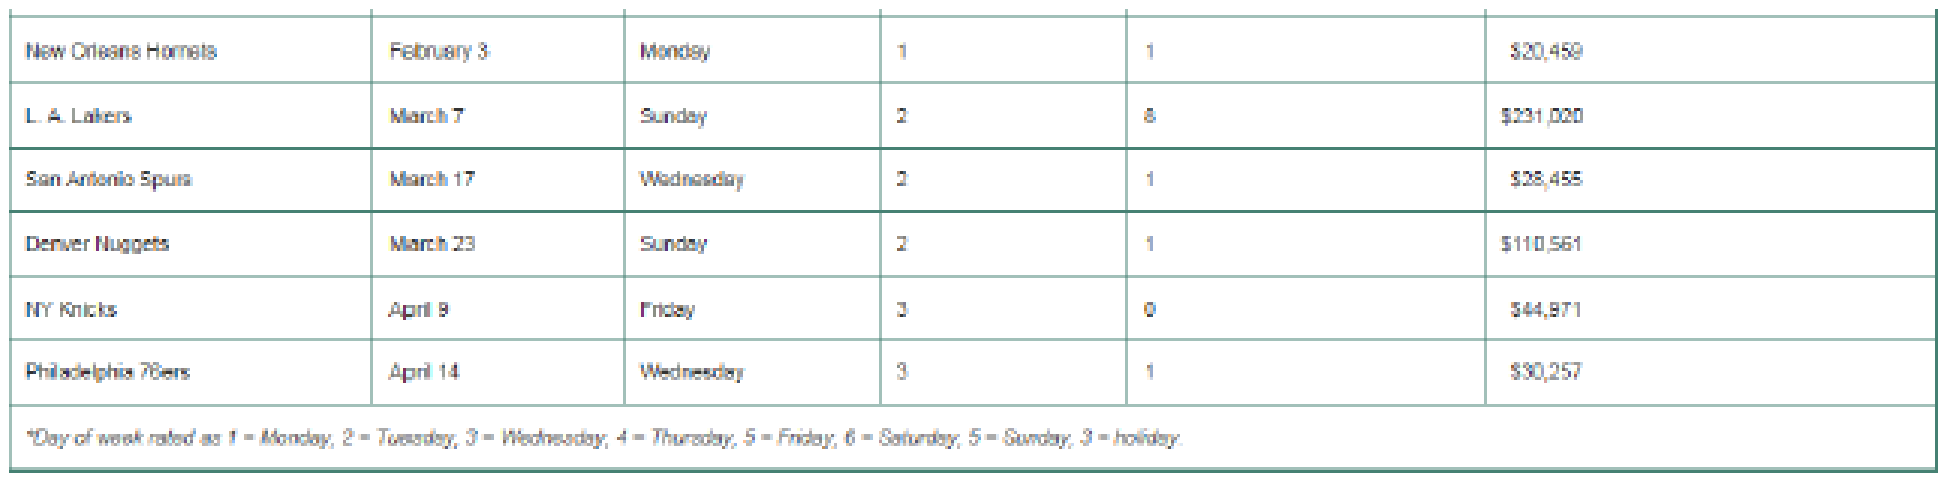
TABLE 4.2 Data for Last Year’s Magic Ticket Sales Pricing Model
His ratings of opponents, done just before the start of the season, were subjective and range from a low of 0 to a high of 8. A very high-rated team in that particular season may have had one or more superstars on its roster, or have won the NBA finals the prior season, making it a popular fan draw.
Finally, Perez believed that the NBA season could be divided into four periods in popularity:
► Early games (which he assigned 0 scores)
► Games during the Christmas season (assigned a 3)
► Games until the All-Star break (given a 2)
► Games leading into the play-offs (scored with a 3)
The first year Perez built his multiple-regression model, the dependent variable y, which was a “potential premium revenue score,” yielded an R2 =.86 with this equation:
Table 4.2 illustrates, for brevity in this case study, a sample of 12 games that year (out of the total 41 home game regular season), including the potential extra revenue per game (y) to be expected using the variable pricing model.
A leader in NBA variable pricing, the Orlando Magic have learned that regression analysis is indeed a profitable forecasting tool.
1. Use the data in Table 4.2 to build a regression model with day of the week as the only independent variable.
3. Using Perez’s multiple-regression model, what would be the additional sales potential of a Thursday Miami Heat game played during the Christmas holiday?
Want to see the full answer?
Check out a sample textbook solution
Chapter 4 Solutions
Operations Management


- Scenario 3 Ben Gibson, the purchasing manager at Coastal Products, was reviewing purchasing expenditures for packaging materials with Jeff Joyner. Ben was particularly disturbed about the amount spent on corrugated boxes purchased from Southeastern Corrugated. Ben said, I dont like the salesman from that company. He comes around here acting like he owns the place. He loves to tell us about his fancy car, house, and vacations. It seems to me he must be making too much money off of us! Jeff responded that he heard Southeastern Corrugated was going to ask for a price increase to cover the rising costs of raw material paper stock. Jeff further stated that Southeastern would probably ask for more than what was justified simply from rising paper stock costs. After the meeting, Ben decided he had heard enough. After all, he prided himself on being a results-oriented manager. There was no way he was going to allow that salesman to keep taking advantage of Coastal Products. Ben called Jeff and told him it was time to rebid the corrugated contract before Southeastern came in with a price increase request. Who did Jeff know that might be interested in the business? Jeff replied he had several companies in mind to include in the bidding process. These companies would surely come in at a lower price, partly because they used lower-grade boxes that would probably work well enough in Coastal Products process. Jeff also explained that these suppliers were not serious contenders for the business. Their purpose was to create competition with the bids. Ben told Jeff to make sure that Southeastern was well aware that these new suppliers were bidding on the contract. He also said to make sure the suppliers knew that price was going to be the determining factor in this quote, because he considered corrugated boxes to be a standard industry item. As the Marketing Manager for Southeastern Corrugated, what would you do upon receiving the request for quotation from Coastal Products?arrow_forwardCost Planning; Gasoline Prices In June 2008, when gasoline prices were at an all-time high(more than $4 per gallon), Chrysler Motor Company promoted its Jeep vehicle with the offer of either$4,500 off the price of the vehicle or the guarantee that the buyer would not pay more than $2.99 pergallon of gas for the next 3 years (the details of the guarantee could vary by dealer).Required1. Assume that the Jeep vehicle you are interested in gets 15 mpg combined city/highway and that at thetime of purchase, you expected gasoline prices to average $5 per gallon over the next 3 years. How manymiles would you have to drive the vehicle in the next 3 years to make the guarantee more attractive thanthe $4,500 discount?arrow_forwardWhich option is correct pleasearrow_forward
- Previous Problem Problem List Next Problem (1 point) Using diaries for many weeks, a study on the lifestyles of visually impaired students was conducted. The students kept track of many lifestyle variables including how many hours of sleep obtained on a typical day. Researchers found that visually impaired students averaged 9.2 hours of sleep, with a standard deviation of 2.24 hours. Assume that the number of hours of sleep for these visually impaired students is normally distributed. (a) What is the probability that a visually impaired student gets less than 6.4 hours of sleep? answer: (b) What is the probability that a visually impaired student gets between 6.2 and 8.84 hours of sleep? answer: (c) Thirty percent of students get less than how many hours of sleep on a typical day? answer: hours Note: You can earn partial credit on this problem. Preview My Answers Submit Answers You have attempted this problem 0 times. You have unlimited attempts remaining.arrow_forward#3 Mention some drawbacks of the Linear Model?arrow_forwardexplain discrete -event simulation model with example.arrow_forward
- B& Co. is a large manufacturer if an electronic product (NM65). It is the market leader in the particular product segment. The market size is increasing due to increasing popularity of its product. B& Co. has received an offer from a manufacturer of electronic products to produce NM 65 on half of B& Co. and directly supply to the customers of the Northern region. The billing on the customer will done by B& Co. The offer is economically attractive. Required: Write a note on what qualitative factors should be considered before deciding in favour or against accepting the offer.arrow_forwardProblem 20-14 (Algo) Charlie's Pizza orders all of its pepperoni, olives, anchovies, and mozzarella cheese to be shipped directly from Italy. An American distributor stops by every six weeks to take orders. Because the orders are shipped directly from Italy, they take five weeks to arrive. Charlie's Pizza uses an average of 160 pounds of pepperoni each week, with a standard deviation of 26 pounds. Charlie's prides itself on offering only the best-quality ingredients and a high level of service, so it wants to ensure a 99 percent probability of not stocking out on pepperoni. Assume that the sales representative just walked in the door and there are currently 500 pounds of pepperoni in the walk-in cooler. How many pounds of pepperoni would you order? (Use Excel's NORMSINV() function to find the correct critical value for the given a-level. Do not round Intermediate calculations. Round "z" value to 2 decimal places and final answer to the nearest whole number.) Amount of pepperoni's…arrow_forwardAndrew Thomas, a sandwich vendor at Hard Rock Cafe's annual Rockfest, created a table of conditional values for the various alternatives (stocking decision) and states of nature (size of crowd) States of Nature (demand) Average $12,000 $9,000 $8,100 Big Small $22,000 -$2,000 Alternatives Large Stock Average Stock Small Stock $12,000 $6,000 $9,000 $4,000 The probabilities associated with the states of nature are 0.20 for a big demand, 0.45 for an average demand, and 0.35 for a small demand a) The alternative that provides Andrew Thomas the greatest expected monetary value (EMV) isarrow_forward
- Q4. RKE & Associates is considering the purchase of a building it currently leases for $30,000 per year. The owner of the building put it up for sale at a price of $170,000, but because the firm has been a good tenant, the owner offered to sell it to RKE for a cash price of $160,000 now. If purchased now, how long will it be before the company recovers its investment at an interest rate of 15% per year?(Do not use excel)arrow_forwardA property's annual property taxes equaled $7,560. The seller owes the buyer for 20 days c prorated property taxes. Using the 360-day calendar, how much does the seller owe the buyer? $1,950 $360 $2,100 $420arrow_forwardProblem 3-14 (Algo) Demand for stereo headphones and music players for joggers has caused Nina Industries to grow almost 50 percent over the past year. The number of joggers continues to expand, so Nina expects demand for headsets to also expand, because, as yet, no safety laws have been passed to prevent joggers from wearing them. Demand for the players for this year was as follows: MONTH DEMAND (UNITS) 4,150 4,25e 3,950 4, 350 4,95e 4,650 5,25e 4,850 5,35e 5,65e 6,25e 5,95e January February March Аpril Мay June July August September October November December a. Using linear regression analysis, what would you estimate demand to be for each month next year? Using a spreadsheet, follow the general format in Exhibit 3.8. (Do not round Intermedlate calculatlons. Round your answers to 2 decimal places.) Month Forecast January February March April May June July August September October November December b. To be reasonably confident of meeting demand, Nina decides to use 3 standard errors…arrow_forward
 Practical Management ScienceOperations ManagementISBN:9781337406659Author:WINSTON, Wayne L.Publisher:Cengage,
 Purchasing and Supply Chain ManagementOperations ManagementISBN:9781285869681Author:Robert M. Monczka, Robert B. Handfield, Larry C. Giunipero, James L. PattersonPublisher:Cengage Learning