
Concept explainers
Videos
(a)
To calculate: The domain of the function
(a)
Answer to Problem 1PRE
Solution:
The domain of the function is
Explanation of Solution
Given:
The function,
Calculation:
The domain is the all possible input for any provided function.
Here, the domain will be
(b)
The range of the function
(b)
Answer to Problem 1PRE
Solution: The range is
Explanation of Solution
Given:
The range is all the possible outputs of a given function,
Here, for
Hence, the range is
(c)
The x-intercept(s) of the function
(c)
Answer to Problem 1PRE
Solution: There is no x-intercept.
Explanation of Solution
Given:
To find the x-intercept(s), solve the equation
This is false,
Hence, there is no x-intercept.
(d)
The y-intercept(s) of the function
(d)
Answer to Problem 1PRE
Solution: The y-intercept is
Explanation of Solution
Given:
To find the y-intercept(s), evaluate
The y-intercept is 3.
(e)
The asymptotes if applicable for the function
(e)
Answer to Problem 1PRE
Solution: No asymptotes.
Explanation of Solution
Given:
Since the given function is a constant function, i.e., no curve involved.
Hence, no asymptotes.
(f)
The intervals over which the function
(f)
Answer to Problem 1PRE
Solution: Never increasing.
Explanation of Solution
Given:
Since the given function is a constant function, i.e., no curve involved.
Hence, never increasing.
(g)
The intervals over which the function
(g)
Answer to Problem 1PRE
Solution: Never decreasing.
Explanation of Solution
Given:
A function is an increasing function if the function values increase within the given interval. Similarly, a function is a decreasing function if the function values decrease within the given interval.
Since the given function is a constant function, i.e., no curve involved.
Hence, the given function
(h)
The match of the function
(h)
Answer to Problem 1PRE
Solution: Graph E.
Explanation of Solution
Given:
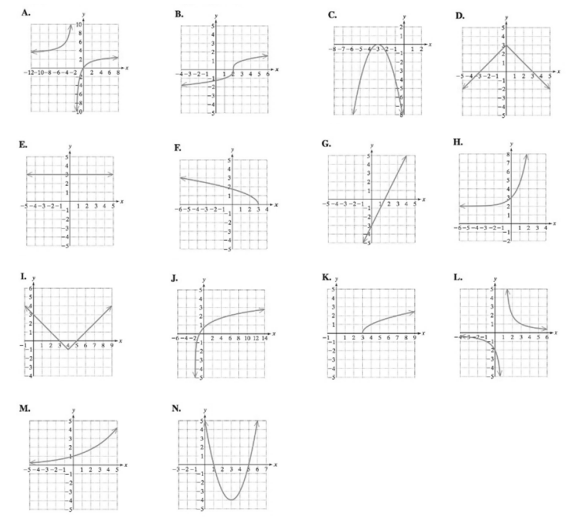
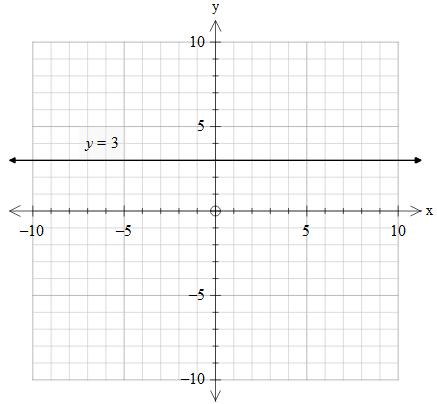
Since the given function is a constant function where for any value of x the output is 3,
Hence the graph will be a horizontal straight line crossing the y-axis at
The correct match will be graph E
Want to see more full solutions like this?
Chapter 4 Solutions
Aleks 360 Access Card (18 Weeks) for College Algebra Essentials


- Find the point on the graph of f(x) = √x that is closest to the point (6, 0).arrow_forwardSuppose that the function y = f(x) is decreasing on the interval [ - 2, 7].(a) Over what interval is the graph of y = f(x + 2) decreasing?(b) Over what interval is the graph of y = f(x - 5) decreasing?(c) What can be said about the graph of y = - f(x)?(d) What can be said about the graph of y = f( - x)?arrow_forwardA water ride with heights above and below the starting point can be modeled by the function y=3sin(π2(x+3)−2). Within the interval 0<x<5, when does the ride have a height 1 foot below the starting point?arrow_forward
- The function describes the number of people, f(t), who have become ill with influenza t weeks after its initial outbreak in a town with 30,000 inhabitants. a. How many people became ill with the flu when the epidemic began? b. How many people were ill by the end of the fourth week? c. What is the limiting size of f(t), the population that becomes ill?arrow_forwardIs the function Increasing, Decreasing, or Both? Is the function Even, Odd, or Neither? What is the Vertical Asymptote? What is the Horizontal Asymptote? What are the End Behaviors? As x⟶ −∞, f(x)⟶ ? and As x⟶ ∞, f(x) ⟶ ? What are the Other Behaviors? As x⟶ −1^−, f(x) ⟶ ? and As x⟶ −1^+, f(x) ⟶ ?arrow_forwardFind the formula for a function that has a vertical asymptotes x=4 and x=6 and a horizontal asymptote y=4arrow_forward
- Find the following questions concerning the graph of the function to the right. Where is the function: increasing? decreasing? Constant? Relative maximum? relative minimum?arrow_forwardThe function models the number of people, f(t), in a city who have become ill with influenza t weeks after its initial outbreak. a. How many people became ill with the flu when the epidemic began? b. How many people were ill by the end of the sixth week? c. What is the limiting size of f(t), the population that becomes ill?arrow_forwardDetermine at which x-values is the graph a. increasing b. decreasing c. constantarrow_forward
- does y=e9-x2-2 exist? whaet is the domain and range of the function if existsarrow_forwardDescribe how you could use the graph of f(x) = 2x to obtain a decimal approximation for √2.arrow_forwardFind the points on the graph of the function that are closest to the given point. f(x)=x to the power of 2, (0,6)arrow_forward
 Glencoe Algebra 1, Student Edition, 9780079039897...AlgebraISBN:9780079039897Author:CarterPublisher:McGraw Hill
 Algebra & Trigonometry with Analytic GeometryAlgebraISBN:9781133382119Author:SwokowskiPublisher:Cengage