Elementary Statistics: Picturing the World, Books a la Carte Edition (7th Edition)
7th Edition
ISBN: 9780134683751
Author: Ron Larson, Betsy Farber
Publisher: PEARSON
bartleby

Concept explainers

bartleby

Videos

Textbook Question
Book Icon
Chapter 4, Problem 1UA

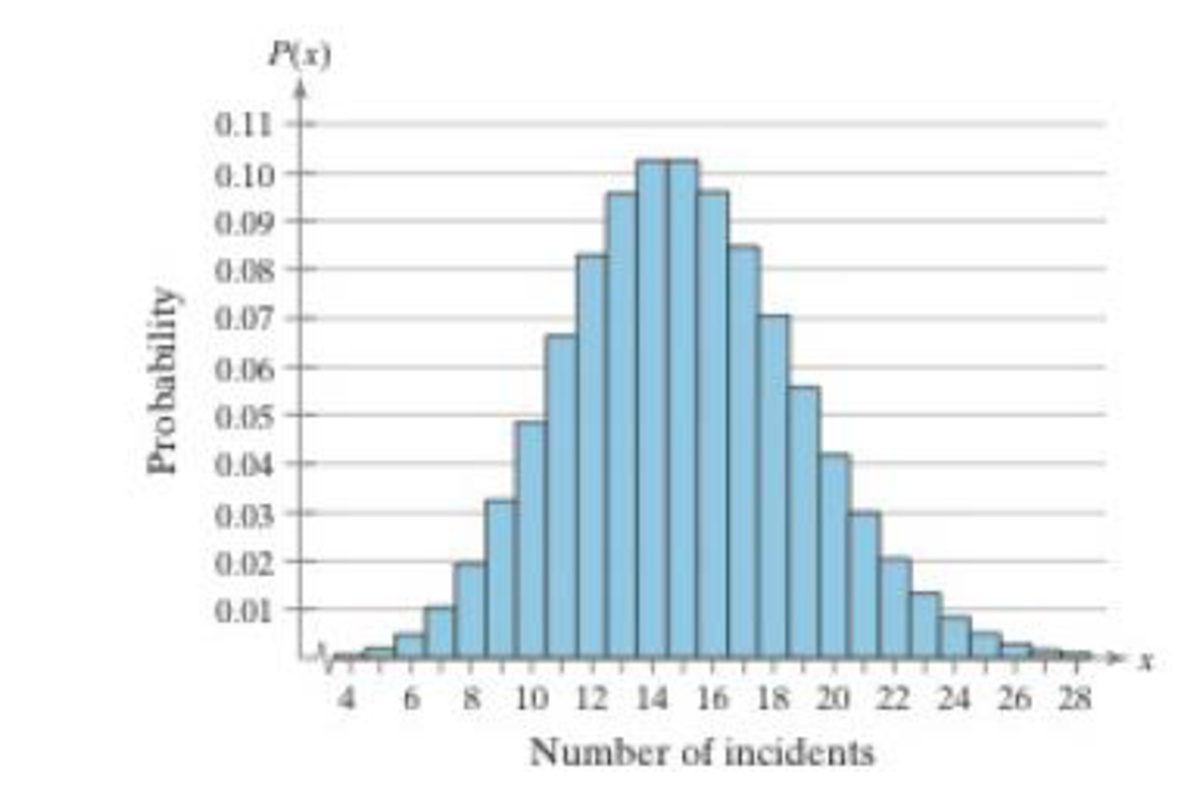
In Exercises 1–3, assume the fire department guidelines are correct and that they respond to an average of 15 emergency incidents per day. Use the graph of the Poisson distribution and technology to answer the questions. Explain your reasoning.

Chapter 4, Problem 1UA, In Exercises 13, assume the fire department guidelines are correct and that they respond to an

1. On a random day, what is more likely, 15 emergency incidents or at least 20 incidents?

Expert Solution & Answer
Check Mark
To determine
The more likely event.

Answer to Problem 1UA

The probability of getting at least 20 emergency incidents is more likely to happen.

Explanation of Solution

Given info:

The mean number of emergency incidents per day is 15. On a random day, two events are considered: one is 15 emergency incidents and the other is at least 20 incidents.

Calculation:

Define the random variable x as the number of emergency incidents that happened on any given day. Here, the average number of emergency incidents per day is 15 incidents and each occurrence of emergency incidents is independent of the other. Hence, the random variable follows Poisson distribution.

The Poisson distribution formula is given below:

P(x)=μxeμx!

Here, x is the number occurrences of the event in a given interval, μ is the mean occurrences of the event, e is a constant and its value is 2.71828.

Consider x as 15, μ as 15 and e as 2.71828.

Software procedure:

Step-by-step procedure for calculating the Poisson probability is given below:

  • Click on Calc, Probability distributions and select Poisson.
  • Choose Probability.
  • Under Mean enter 15.
  • Under Input constant, enter 15.
  • Click ok.

Output obtained from MINITAB is given below:

Elementary Statistics: Picturing the World, Books a la Carte Edition (7th Edition), Chapter 4, Problem 1UA , additional homework tip  1

Thus, the probability of getting 15 emergency incidents per day is 0.102.

The probability of getting at least 20 emergency incidents per day is given below:

Software procedure:

Step-by-step procedure for calculating the Poisson probability is given below:

  • Click on Calc, Probability distributions and select Poisson.
  • Choose Cumulative Probability.
  • Under Mean enter 15.
  • Under Input constant, enter 19.
  • Click ok.

Output obtained from MINITAB is given below:

Elementary Statistics: Picturing the World, Books a la Carte Edition (7th Edition), Chapter 4, Problem 1UA , additional homework tip  2

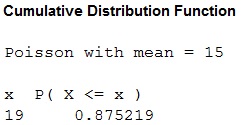
The probability of getting at least 20 emergency incidents is as follows:

P(Getting at least20 emergency incidents)=P(x20)=1P(x<20)=1P(x19)=10.875

                                              =0.125

Thus, the probability of getting at least 20 emergency incidents is 0.125.

Conclusion:

The probability of getting at least 20 emergency incidents is more likely to happen when compared to 15 emergency incidents. This is because the probability of at least 20 emergency incidents is more than the probability of 15 emergency incidents.

Justification:

The events are unlikely to occur if the probability is less than 0.05.

From the MINITAB output, it can be seen that the probability of getting at least 20 emergency incidents per day is 0.125 and the probability of getting 15 emergency incidents is 0.102.

From the graph, it can be seen that the probability value corresponding to 15 incidents is 0.102 and the probability values corresponding to at least 20 incidents is observed as follows:

P(At least 20 incidents)=P(20)+P(22)+...+P(26)+P(28)=(0.041+0.03+0.021+0.013+0.009+0.005+0.003+0.002+0.001)=0.125

Want to see more full solutions like this?

Subscribe now to access step-by-step solutions to millions of textbook problems written by subject matter experts!

Chapter 4 Solutions

Elementary Statistics: Picturing the World, Books a la Carte Edition (7th Edition)

Ch. 4.1 - What does the mean of a probability distribution...Ch. 4.1 - True or False? In Exercises 58, determine whether...Ch. 4.1 - True or False? In Exercises 58, determine whether...Ch. 4.1 - True or False? In Exercises 58, determine whether...Ch. 4.1 - True or False? In Exercises 58, determine whether...Ch. 4.1 - Graphical Analysis In Exercises 912, determine...Ch. 4.1 - Graphical Analysis In Exercises 912, determine...Ch. 4.1 - Graphical Analysis In Exercises 912, determine...Ch. 4.1 - Graphical Analysis In Exercises 912, determine...Ch. 4.1 - Discrete Variables and Continuous Variables In...Ch. 4.1 - Discrete Variables and Continuous Variables In...Ch. 4.1 - Discrete Variables and Continuous Variables In...Ch. 4.1 - Discrete Variables and Continuous Variables In...Ch. 4.1 - Discrete Variables and Continuous Variables In...Ch. 4.1 - Discrete Variables and Continuous Variables In...Ch. 4.1 - Constructing and Graphing Discrete Probability...Ch. 4.1 - Constructing and Graphing Discrete Probability...Ch. 4.1 - Finding Probabilities Use the probability...Ch. 4.1 - Finding Probabilities Use the probability...Ch. 4.1 - Unusual Events In Exercise 19, would it be unusual...Ch. 4.1 - Unusual Events In Exercise 20, would it be unusual...Ch. 4.1 - Determining a Missing Probability In Exercises 25...Ch. 4.1 - Determining a Missing Probability In Exercises 25...Ch. 4.1 - Identifying Probability Distributions In Exercises...Ch. 4.1 - Identifying Probability Distributions In Exercises...Ch. 4.1 - Finding the Mean, Variance, and Standard Deviation...Ch. 4.1 - Baseball The number of games played in each World...Ch. 4.1 - Finding the Mean, Variance, and Standard Deviation...Ch. 4.1 - Finding the Mean, Variance, and Standard Deviation...Ch. 4.1 - Hurricanes The histogram shows the distribution of...Ch. 4.1 - Reviewer Ratings The histogram shows the reviewer...Ch. 4.1 - Writing The expected value of an accountants...Ch. 4.1 - Writing In a game of chance, what is the...Ch. 4.1 - Finding an Expected Value In Exercises 37and 38,...Ch. 4.1 - A high school basketball team is selling 10 raffle...Ch. 4.1 - Linear Transformation of a Random Variable In...Ch. 4.1 - Prob. 40ECh. 4.1 - What is the average sum of their scores? What is...Ch. 4.1 - What is the standard deviation of the difference...Ch. 4.2 - Determine whether the experiment is a binomial...Ch. 4.2 - A card is selected from a standard deck and...Ch. 4.2 - A survey found that 52% of U.S. adults associate...Ch. 4.2 - The survey in Example 5 found that 27% of U.S....Ch. 4.2 - About 5% of workers (ages 16 years and older) in...Ch. 4.2 - A recent study found that 28% of U.S. adults read...Ch. 4.2 - In San Francisco, California, about 44% of the...Ch. 4.2 - In a binomial experiment, what does it mean to say...Ch. 4.2 - In a binomial experiment with n trials, what does...Ch. 4.2 - Graphical Analysis In Exercises 35, the histogram...Ch. 4.2 - Graphical Analysis In Exercises 35, the histogram...Ch. 4.2 - Graphical Analysis In Exercises 35, the histogram...Ch. 4.2 - Graphical Analysis In Exercises 68, the histogram...Ch. 4.2 - Graphical Analysis In Exercises 68, the histogram...Ch. 4.2 - Graphical Analysis In Exercises 68, the histogram...Ch. 4.2 - Identify the unusual values of x in each histogram...Ch. 4.2 - Identify the unusual values of x in each histogram...Ch. 4.2 - Mean, Variance, and Standard Deviation In...Ch. 4.2 - Mean, Variance, and Standard Deviation In...Ch. 4.2 - Mean, Variance, and Standard Deviation In...Ch. 4.2 - Mean, Variance, and Standard Deviation In...Ch. 4.2 - Identifying and Understanding Binomial Experiments...Ch. 4.2 - Identifying and Understanding Binomial Experiments...Ch. 4.2 - Identifying and Understanding Binomial Experiments...Ch. 4.2 - Identifying and Understanding Binomial Experiments...Ch. 4.2 - Finding Binomial Probabilities In Exercises 1926,...Ch. 4.2 - Finding Binomial Probabilities In Exercises 1926,...Ch. 4.2 - Finding Binomial Probabilities In Exercises 1926,...Ch. 4.2 - Finding Binomial Probabilities In Exercises 1926,...Ch. 4.2 - Finding Binomial Probabilities In Exercises 1926,...Ch. 4.2 - Finding Binomial Probabilities In Exercises 1926,...Ch. 4.2 - Finding Binomial Probabilities In Exercises 1926,...Ch. 4.2 - Finding Binomial Probabilities In Exercises 1926,...Ch. 4.2 - Constructing and Graphing Binomial Distributions...Ch. 4.2 - Constructing and Graphing Binomial Distributions...Ch. 4.2 - Constructing and Graphing Binomial Distributions...Ch. 4.2 - Constructing and Graphing Binomial Distributions...Ch. 4.2 - Finding and Interpreting Mean, Variance, and...Ch. 4.2 - Finding and Interpreting Mean, Variance, and...Ch. 4.2 - Finding and Interpreting Mean, Variance, and...Ch. 4.2 - Finding and Interpreting Mean, Variance, and...Ch. 4.2 - Finding and Interpreting Mean, Variance, and...Ch. 4.2 - Finding and Interpreting Mean, Variance, and...Ch. 4.2 - Genetics According to a theory in genetics, when...Ch. 4.2 - Genetics Another proposed theory in genetics gives...Ch. 4.2 - Manufacturing An assembly line produces 10,000...Ch. 4.2 - Prob. 1ACh. 4.2 - Prob. 2ACh. 4.2 - For the election in Exercise 1, simulate selecting...Ch. 4.2 - 1. Construct a probability distribution for the...Ch. 4.2 - 2. Construct binomial probability distributions...Ch. 4.2 - 3. Compare your distributions from Exercise 1 and...Ch. 4.2 - 4. During the 2016 regular season, Kris Bryant of...Ch. 4.3 - The study in Example 1 found that the smartphones...Ch. 4.3 - What is the probability that more than four...Ch. 4.3 - Two thousand brown trout are introduced into a...Ch. 4.3 - In Exercises 14, find the indicated probability...Ch. 4.3 - Prob. 2ECh. 4.3 - In Exercises 14, find the indicated probability...Ch. 4.3 - Prob. 4ECh. 4.3 - In Exercises 58, find the indicated probability...Ch. 4.3 - Prob. 6ECh. 4.3 - In Exercises 58, find the indicated probability...Ch. 4.3 - In Exercises 58, find the indicated probability...Ch. 4.3 - Prob. 9ECh. 4.3 - In your own words, describe the difference between...Ch. 4.3 - Prob. 11ECh. 4.3 - Using a Distribution to Find Probabilities In...Ch. 4.3 - Using a Distribution to Find Probabilities In...Ch. 4.3 - Using a Distribution to Find Probabilities In...Ch. 4.3 - Using a Distribution to Find Probabilities In...Ch. 4.3 - Using a Distribution to Find Probabilities In...Ch. 4.3 - Using a Distribution to Find Probabilities In...Ch. 4.3 - Using a Distribution to Find Probabilities In...Ch. 4.3 - Using a Distribution to Find Probabilities In...Ch. 4.3 - Using a Distribution to Find Probabilities In...Ch. 4.3 - Using a Distribution to Find Probabilities In...Ch. 4.3 - Using a Distribution to Find Probabilities In...Ch. 4.3 - Using a Distribution to Find Probabilities In...Ch. 4.3 - Using a Distribution to Find Probabilities In...Ch. 4.3 - Using a Distribution to Find Probabilities In...Ch. 4.3 - Using a Distribution to Find Probabilities In...Ch. 4.3 - Comparing Binomial and Poisson Distributions An...Ch. 4.3 - Hypergeometric Distribution Binomial experiments...Ch. 4.3 - Geometric Distribution: Mean and Variance In...Ch. 4.3 - Geometric Distribution: Mean and Variance In...Ch. 4.3 - Prob. 31ECh. 4.3 - Geometric Distribution: Mean and Variance In...Ch. 4 - In Exercises 13, assume the fire department...Ch. 4 - In Exercises 13, assume the fire department...Ch. 4 - In Exercises 13, assume the fire department...Ch. 4 - In Exercises 1 and 2, determine whether the random...Ch. 4 - In Exercises 1 and 2, determine whether the random...Ch. 4 - In Exercises 3 and 4, (a) construct a probability...Ch. 4 - In Exercises 3 and 4, (a) construct a probability...Ch. 4 - In Exercises 5 and 6, determine whether the...Ch. 4 - In Exercises 5 and 6, determine whether the...Ch. 4 - In Exercises 7 and 8, (a) find the mean, variance,...Ch. 4 - In Exercises 7 and 8, (a) find the mean, variance,...Ch. 4 - In Exercises 9 and 10, find the expected net gain...Ch. 4 - In Exercises 9 and 10, find the expected net gain...Ch. 4 - In Exercises 11 and 12, determine whether the...Ch. 4 - In Exercises 11 and 12, determine whether the...Ch. 4 - In Exercises 1316, find the indicated binomial...Ch. 4 - In Exercises 1316, find the indicated binomial...Ch. 4 - In Exercises 1316, find the indicated binomial...Ch. 4 - In Exercises 1316, find the indicated binomial...Ch. 4 - In Exercises 17 and 18, (a) construct a binomial...Ch. 4 - In Exercises 17 and 18, (a) construct a binomial...Ch. 4 - In Exercises 19 and 20, find the mean, variance,...Ch. 4 - In Exercises 19 and 20, find the mean, variance,...Ch. 4 - In Exercises 2126, find the indicated...Ch. 4 - Prob. 4.3.22RECh. 4 - In Exercises 2126, find the indicated...Ch. 4 - Prob. 4.3.24RECh. 4 - Prob. 4.3.25RECh. 4 - In Exercises 2126, find the indicated...Ch. 4 - Determine whether the random variable x is...Ch. 4 - The table lists the number of wireless devices per...Ch. 4 - Prob. 3CQCh. 4 - The five-year success rate of kidney transplant...Ch. 4 - An online magazine finds that the mean number of...Ch. 4 - Basketball player Dwight Howard makes a free throw...Ch. 4 - Which event(s) in Exercise 6 can be considered...Ch. 4 - In Exercises 13find the indicated probabilities...Ch. 4 - In Exercises 13, find the indicated probabilities...Ch. 4 - In Exercises 13find the indicated probabilities...Ch. 4 - Determine whether the distribution is a...Ch. 4 - The table shows the ages of students in a freshman...Ch. 4 - Seventy-seven percent of U.S. college students pay...Ch. 4 - The Centers for Disease Control and Prevention...Ch. 4 - The Centers for Disease Control and Prevention...Ch. 4 - Suspicious Samples? A lab worker tells you that...Ch. 4 - In Exercises 17, consider a grocery store that can...Ch. 4 - In Exercises 17, consider a grocery store that can...Ch. 4 - Prob. 3TCh. 4 - Prob. 4TCh. 4 - Prob. 5TCh. 4 - In Exercises 17, consider a grocery store that can...Ch. 4 - In Exercises 17, consider a grocery store that can...
Knowledge Booster
Background pattern image
Statistics
Learn more about
Need a deep-dive on the concept behind this application? Look no further. Learn more about this topic, statistics and related others by exploring similar questions and additional content below.
Recommended textbooks for you
Text book image
Big Ideas Math A Bridge To Success Algebra 1: Stu...
Algebra
ISBN:9781680331141
Author:HOUGHTON MIFFLIN HARCOURT
Publisher:Houghton Mifflin Harcourt
Text book image
Glencoe Algebra 1, Student Edition, 9780079039897...
Algebra
ISBN:9780079039897
Author:Carter
Publisher:McGraw Hill
Text book image
Holt Mcdougal Larson Pre-algebra: Student Edition...
Algebra
ISBN:9780547587776
Author:HOLT MCDOUGAL
Publisher:HOLT MCDOUGAL
The Shape of Data: Distributions: Crash Course Statistics #7; Author: CrashCourse;https://www.youtube.com/watch?v=bPFNxD3Yg6U;License: Standard YouTube License, CC-BY
Shape, Center, and Spread - Module 20.2 (Part 1); Author: Mrmathblog;https://www.youtube.com/watch?v=COaid7O_Gag;License: Standard YouTube License, CC-BY
Shape, Center and Spread; Author: Emily Murdock;https://www.youtube.com/watch?v=_YyW0DSCzpM;License: Standard Youtube License