Graphical representation of reduction in employment at minimum wage rate.
Explanation of Solution
The reduction in employment when the wage rate is set above the equilibrium is illustrated below:
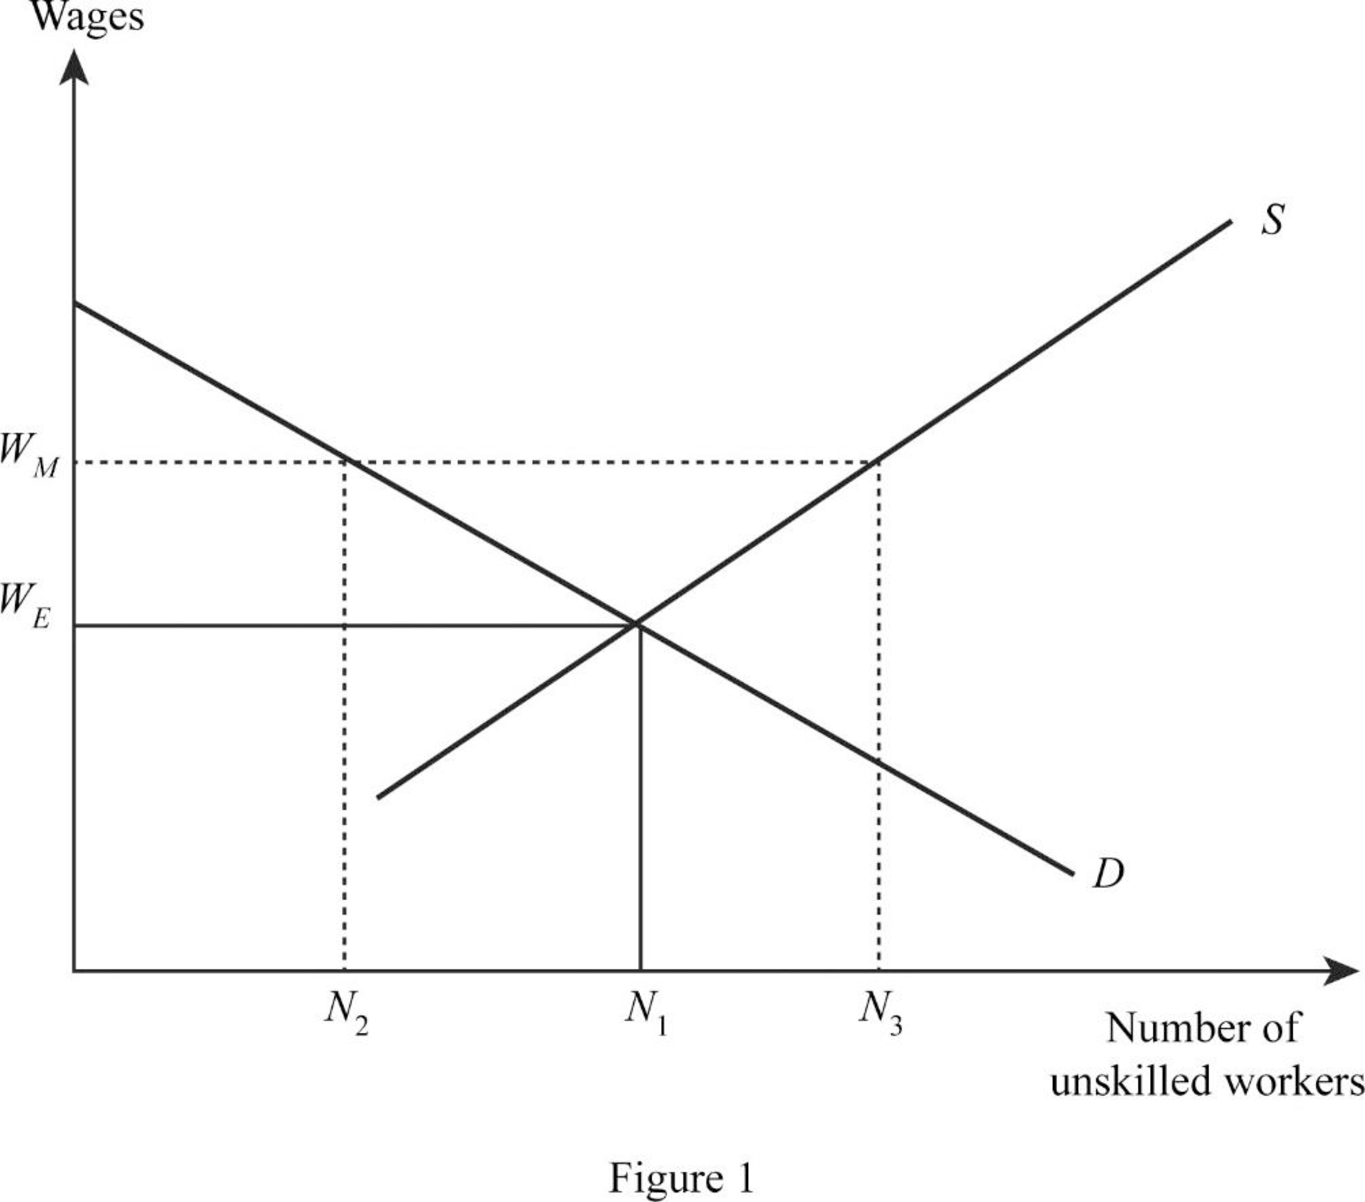
In Figure 1, the horizontal axis represents the number of skilled labor and the vertical axis represents the wage rate. The equilibrium wage rate is at WE, where the
Demand for labor: Demand for labor is defined as the quantity of labor demanded by the firms at different wage rates.
Supply of labor: Supply of labor refers tp the quantity of labor ready to work at the given wage rate.
Want to see more full solutions like this?
Chapter 4 Solutions
Economics (Book Only)

- The imposition of a binding minimum wage makes all workers affected by it better off.Explain why above statements is True, False, or Uncertain according to economic principles. Use diagrams where appropriate.arrow_forwardAccording to the Heritage Foundation report, what are two possible negative effects of an increase in the minimum wagearrow_forwardReferred to the above graph of the labor market. The government decides to impose a wage tax as shown on the graph. If the number of workers hired after the imposition of the tax is 800 then the total amount of tax is $___arrow_forward
- The graph above shows a labor market where the downward-sloping curve is firm demand for labor and the upward-sloping curve is the worker supply curve. The vertical axis shows the hourly wage and the horizontal axis shows the number of full-time workers. Suppose a minimum wage of $9 is instituted. How many unemployed workers will result from the minimum wage? (Note: An unemployed worker is anyone who wants to work but cannot find a job.)arrow_forwardIf the minimum wage is set above the equilibrium wage, the quantity of labor supplied by workers is ______ to the quantity demanded by employers. 1. Lower 2. Same 3. Minor 4. Superiorarrow_forwardOn page 104 of the third (2019) edition of Naked Economics by Charles Wheelan, Wheelan discusses the possible outcomes of minimum wage. Based on what Wheelan has written and the conversations about minimum wage in the class, which of the below statements is the LEAST likely to be correct if the minimum wage (a price floor) is placed well above the market clearing (equilibrium) wage? Group of answer choices The higher the minimum wage is set above the market clearing or equilibrium rate the more likely it is benefit all workers, as everyone's wages will have increased, and employers will not lay off workers because of the higher wages. The higher minimum wage will benefit those who continue to have a job at the higher wage, but will hurt those who are laid off because employers will hire fewer workers at the higher wage rate. In an era of global production and a global labor pool in which wages in the U.S. are higher than the wages paid to workers in countries such as Mexico, the…arrow_forward

 Economics (MindTap Course List)EconomicsISBN:9781337617383Author:Roger A. ArnoldPublisher:Cengage Learning
 Essentials of Economics (MindTap Course List)EconomicsISBN:9781337091992Author:N. Gregory MankiwPublisher:Cengage Learning
 Brief Principles of Macroeconomics (MindTap Cours...EconomicsISBN:9781337091985Author:N. Gregory MankiwPublisher:Cengage Learning
