
Concept explainers
Videos
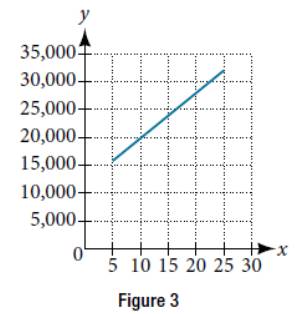
For the following exercises, use the graph in Figure 3, showing the profit, y, in thousands of dollars, of a company in a given year, x, where x represents years since 1980.
In 2004, a school population was 1250. By 2012 the population had dropped to 875. Assume the population is changing linearly.
a. How much did the population drop between the year 2004 and 2012?
b. What is the average population decline per year?
c. Find an equation for the population, P, of the school t years after 2004.
Want to see the full answer?
Check out a sample textbook solution
Chapter 4 Solutions
College Algebra
Additional Math Textbook Solutions
Elementary and Intermediate Algebra
College Algebra in Context with Applications for the Managerial, Life, and Social Sciences (5th Edition)
College Algebra (5th Edition)
A Graphical Approach to College Algebra (6th Edition)
Introductory and Intermediate Algebra for College Students (5th Edition)
College Algebra with Modeling & Visualization (6th Edition)


- For the following exercises, use the graph in Figure 3, showing the profit, y, in thousands of dollars, of a company in a given year, x, where x represents years since 1980. Draw a scatter plot for the data provided in Table 3. Then determine whether the data appears to be linearly related.arrow_forwardFor the following exercise, consider this scenario: In 2004, a school population was 1,700. By 2012 the population had grown to 2,500. Assume the population is changing linearly. a. How much did the population grow between the year 2004 and 2012? b. What is the average population growth per year? c. Find an equation for the population, P, of the school t years after 2004.arrow_forwardFor the following exercises, use the graph in Figure 1 showing the profit, y, in thousands ofdollars, of a company ina given year, 1, where x represents years since 1980. 27. Find the linear function y, where y depends on x, the number of years since 1980.arrow_forward
- For the following exercises, use the graph in Figure 8, which shows the profit, y, in thousands of dollars, of a companyin a given year, t, where trepresents the number of years since 1980. 35. Find the linear function y, where y depends on t, the number of years since 1980.arrow_forwardFor the following exercises, consider this scenario: The number of people afflicted with the common cold in the winter months steadily decreased by 205 each year from 2.005 until 2010. In 2005, 12,025 people were afflicted. Find the linear function that models the number of people in?icted with the common cold, C, as a function of the year, t.arrow_forwardFor the following exercises, use the graph in Figure 1 showing the profit, y, in thousands of dollars, of a company in a given year, 1, where x represents years since 1980. Find and interpret the y-intercept.arrow_forward
- For the following exercises, use the median home values in Indiana and Alabama (adjusted for inflation) shown in Table 3. Assume that the house values are changing linearly. In which state have home values increased at a higher rate?arrow_forwardFor the following exercises, use the graph in Figure 8, which shows the profit, y, in thousands of dollars, of a companyin a given year, t, where trepresents the number of years since 1980. 38. Find and interpret the slope.arrow_forwardFor the following exercises, consider this scenario: A town has an initial population of 75,000. It grows at a constant rate of 2,500 per year for 5 years. If the function P is graphed, find and interpret the slope of the function.arrow_forward
- For the following exercises, use Table 4 which shows the percent of unemployed persons 25 years or older who are college graduates in a particular city, by year. Determine whether the trend appears linear. If so, and assuming the trend continues, find a linear regression model to predict the percent of unemployed in a given year to three decimal places.arrow_forwardFor the following exercises, use the graph in Figure 8, which shows the profit, y, in thousands of dollars, of a companyin a given year, t, where trepresents the number of years since 1980. 36. Find and interpret the y-intercept.arrow_forwardFor the following exercises, use the graph in Figure 3, showing the profit, y, in thousands of dollars, of a company in a given year, x, where x represents years since 1980. Find and interpret the y-intercept.arrow_forward
