
Concept explainers
Videos
Video Case
With the growth of Hard Rock Cafe—from one pub in London in 1971 to more than 150 restaurants in 53 countries today—came a corporatewide demand for better forecasting. Hard Rock uses long-range forecasting in setting a capacity plan and intermediate-term forecasting for locking in contracts for leather goods (used in jackets) and for such food items as beef, chicken, and pork Its short-term sales forecasts are conducted each month, by cafe, and then aggregated for a headquarters view.
The heart of the sales forecasting system is the point-of-sale (POS) system, which, in effect, captures transaction data on nearly every person who walks through a cafe’s door. The sale of each entrée represents one customer; the entrée sales data are transmitted daily to the Orlando corporate headquarters’ database. There, the financial team, headed by Todd Lindsey, begins the forecast process. Lindsey forecasts monthly guest counts, retail sales, banquet sales, and concert sales (if applicable) at each cafe. The general managers of individual cafes tap into the same database to prepare a daily forecast for their sites. A cafe manager pulls up prior years’ sales for that day, adding information from the local Chamber of Commerce or Tourist Board on upcoming events such as a major convention, sporting event, or concert in the city where the cafe is located. The daily forecast is further broken into hourly sales, which drives employee
Hard Rock doesn’t limit its use of forecasting tools to sales. To evaluate managers and set bonuses, a 3-year weighted moving average is applied to cafe sales. If cafe general managers exceed their targets, a bonus is computed. Todd Lindsey, at corporate headquarters, applies weights of 40% to the most recent year’s sales, 40% to the year before, and 20% to sales 2 years ago in reaching his moving average.
An even more sophisticated application of statistics is found in Hard Rock’s menu planning. Using multiple regression, managers can compute the impact on demand of other menu items if the price of one item is changed. For example, if the price of a cheeseburger increases from $7.99 to $8.99, Hard Rock can predict the effect this will have on sales of chicken sandwiches, pork sandwiches, and salads. Managers do the same analysis on menu placement, with the center section driving higher sales volumes. When an item such as a hamburger is moved off the center to one of the side flaps, the corresponding effect on related items, say trench fries, is determined.
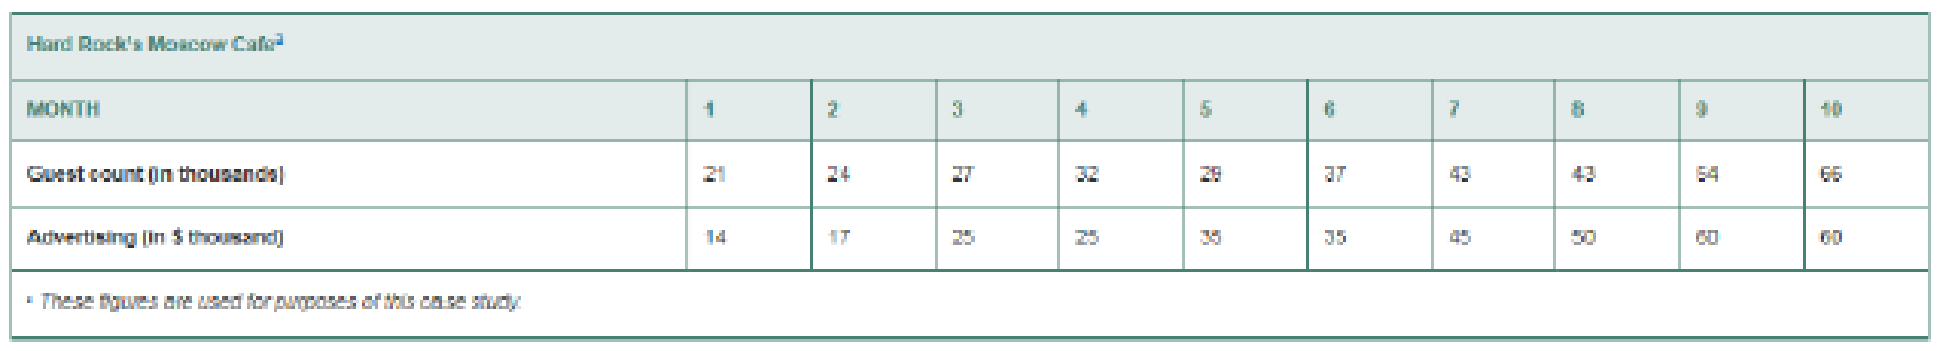
5. At Hard Rock’s Moscow restaurant, the manager is trying to evaluate how a new advertising campaign affects guest counts. Using data for the past 10 months (see the table), develop a least squares regression relationship and then forecast the expected guest count when advertising is $65,000.
Want to see the full answer?
Check out a sample textbook solution
Chapter 4 Solutions
Mylab Operations Management With Pearson Etext -- Access Card -- For Operations Management: Sustainability And Supply Chain Management (13th Edition)


- Question #2 Month Demand 1 45 2 48 3 43 4 48 5 49 6 54 7 47 8 50 9 46 10 47 Using the table above, calculate two forecasts using the following method:- First, for periods 4 through 10, develop the exponentially smoothed forecasts using a forecast for period 3 (F3) of 45.0 and an alpha of 0.4. ii. Calculate the weighted moving average for periods 4 through 10, using weights of .70, .20, and .10, with 0.70 applied to the most recent data. iii. Calculate the mean absolute deviation (MAD) for each forecasting procedure. Which forecasting procedure would you select? Why?arrow_forwardQUESTION ONE (b) The forecast of a product for the first week of January was 200 units, whereas the actual demand turned out to be 220 units. i. Find the forecast for the week of January assuming the smoothing constant 0.2 α = ii. Find the forecast for the third week of third week of January if the actual demand of the second week is 210 unitsarrow_forward1. The FedEx Company supports its global network, the company has 51 customer service call centers, whose service goal is to answer 90% of calls within 20 seconds. With million daily calls, FedEx makes extensive use of forecasting models for the number of calls, average handling time, and staffing decisions and to ensure the highest customer satisfaction. Question: Being an Operational Manager, guide with reasons for the company to use appropriate forecasting models.arrow_forward
- Question 2 i. Differentiate between independent and dependent variable in forecasting. ii. The last seven weeks of sales at KC car dealership can be seen in Table 2 below. Table 2 Week Sales 1 25 2 30 3 27 4 31 5 27 6 29 7 30 8 a. Use a three-period weighted-moving average forecast to determine a forecast for the 8th week using weights of 3, 2, and 1 (where the most recent week receives the highest weight). (Round all forecasts to the nearest whole unit.) b. Calculate the MAD for this forecast. c. What does the MAD indicate?arrow_forwardQuestion 16 Daily demand for sandwiches at a local deli is shown in the table. Using a 3 period weighted moving average (most recent demands receive the highest weights) with weights W1 = 0.50, W2 = 0.30 and W3 = 0.20, what is the forecast for day 8? Group of answer choices a. 39.3 sandwiches b. 41.3 sandwiches c. 43 sandwiches d. 43.3 sandwiches e. Impossible to determinearrow_forwardQUESTION 1The table below shows the sales figures for a brand of shoe over the last 12 months. Months SalesJanuary 69February 75March 86April 92May 95June 100July 108August 115September 125October 131November 140December 150 a. Using the following, forecast the sales for the months up to January the following year:- ii. A three period weighted moving average using weights of 1, 2 and 3. Assign thehighest weight to the most recent data.arrow_forward
- QUESTION 1The table below shows the sales figures for a brand of shoe over the last 12 months.Months SalesJanuary 69February 75March 86April 92May 95June 100July 108August 115September 125October 131November 140December 150a. Using the following, forecast the sales for the months up to January the following year:-i. A simple three month moving average. ii. A three period weighted moving average using weights of 1, 2 and 3. Assign thehighest weight to the most recent data. iii. Exponential Smoothing when α= .6 and the forecast for March is 350.iv. Determine which of the three forecasting technique is the most accurate usingMAD. b. The following table shows the number of televisions sold over the last ten years at alocal electronic store.YEAR TV SALES1 1502 3003 4804 6005 6306 6407 7008 8259 90010 980i. Using trend projection, develop a formula to predict sales for years 11 and 12. Youhave to show all working. You will need to develop a table to calculate the slope andthe intercept.…arrow_forwardQUESTION 5 Choose the answer with the best match. Elements of a Good Forecast, Meaningful: The benefits should outweigh the costs It should work consistently The degree of accuracy of the forecast should be stated The forecasting horizon must cover the time necessary to implement possible changes so that its results can be used The units measured should be useful to those using the forecast QUESTION 6 There are two main approaches to forecasting. Choose the best two: Quantitative, Consumer Judgmental, Quantitative Sales force, Judgmental Historical, Consumer Expert, Executive QUESTION 7 Describe the following: Andon Maintaining equipment in good condition Maintaining a workplace that is clean System for moving work to the next station as it is completed System of lights used at each workstation to…arrow_forwardQuestion 1. Question : (TCOs 6 and 8) What is the approximate forecast for July using a 40-month moving average if the historical demand is as follows: January is 35, February is 36, March is 40, April is 43, May is 48, and June is 49? 38 45 42 43 39 Question 4. Question : (TCO 8) Given an alpha factor of 0.4, a current demand for April of 5,500 units, and a March forecast of 4,900 units, calculate the May forecast. 4,000 6,050 5,080 4,520 5,140 Question 6. Question : (TCOs 5 and12) With a demand during lead time of 130, a safety stock of 20, and a container size of 30, how many kanbans (containers) would be needed? 6 5 8 10 16 Question 8. Question : (TCOs 6 and 8) In the process of using seasonal indices for forecasting, the first step that is taken is compute the average demand over all months. estimate next year’s total annual demand. divide the estimate of total annual demand by the number of seasons. find the average historical demand each…arrow_forward
- Q. 13 Weekly demand for cases of canned food at a local grocery outlet is shown. Using a 2 period moving average, what is the forecast for week 6? Group of answer choices a. 5 b. 6 c. 7 d. 8 e. 9arrow_forwardQuestion 1 Forecasting calculation X Month Sales (y)(000 units) 1 Feb. 19 2 Mar. 18 3 Apr. 15 4 May 20 5 Jun. 18 6 Jul. 22 7 Aug. 20 8 Sep a. Using a 5-month moving average, calculate September sales b. Calculate September sales Using a 3-month weighted moving average (weights are 0.60, 0.30. 0.10). c. Calculatate Exponential Smoothing (assume February sale is 19) sales in September (alpha 0.2, that means 1-0.2 = 0.8) d. Using regression analysis, what is Y (September sales) if X is 8? (use data> data analysis button> regression)arrow_forwardQ 6 Identify two business situations where the Delphi method might be used to generate forecasts. Can you think of any difficulties and pitfalls associated with using the Delphi method?arrow_forward
 Practical Management ScienceOperations ManagementISBN:9781337406659Author:WINSTON, Wayne L.Publisher:Cengage,
 Operations ManagementOperations ManagementISBN:9781259667473Author:William J StevensonPublisher:McGraw-Hill Education
 Operations and Supply Chain Management (Mcgraw-hi...Operations ManagementISBN:9781259666100Author:F. Robert Jacobs, Richard B ChasePublisher:McGraw-Hill Education
 Purchasing and Supply Chain ManagementOperations ManagementISBN:9781285869681Author:Robert M. Monczka, Robert B. Handfield, Larry C. Giunipero, James L. PattersonPublisher:Cengage Learning
 Production and Operations Analysis, Seventh Editi...Operations ManagementISBN:9781478623069Author:Steven Nahmias, Tava Lennon OlsenPublisher:Waveland Press, Inc.