
Videos
Conducting a Financial Ratio Analysis on HP INC.
Use online resources to work on this chapter's questions. Please note that website information changes over time, and these changes may limit your ability to answer some of these questions.
In Chapter 3, we looked at Dunkin' Brands' financial statements. In this chapter, we will use financial Internet websites (specifically, www.morningstar.com and www.google.com/finance) to analyze HP Inc., a computer hardware company. Once on either website, you simply enter HP Inc.'s ticker symbol (HPQ) to obtain the financial information needed.
The text mentions that financial statement analysis has two major components: a trend analysis, where we evaluate changes in key ratios over time, and a freer analysis, where we compare financial ratios with firms that are in the same industry and/or line of business. We will do both of these types of analysis in this problem.
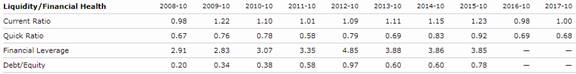
Through the Morningstar website, you can find the firm's financials (Income Statement, Balance Sheet, and Cash Flow) on an annual or quarterly basis for the five most recent time periods. In addition, the site contains Key Ratios (Profitability’, Growth, Cash Flow, Financial Health, and Efficiency) for 10 years. We will use the Key Ratios on this site to conduct the firm's trend analysis. (At the bottom of the screen you will see that you can click "Glossary" to find definitions for the different ratios. For example, Morningstar's Financial Leverage ratio is the same as the Equity multiplier that we use in the textbook.)
On the Google Finance site, you can find the firm’s financial statements for the four most recent years or the five most recent quarters and key financial data for related companies for the most recent year or quarter. We will use the related companies' annual data to conduct the firm's peer analysis. Notice that when you go to the "Related Companies" screen, you can "add or remove columns." Click on that phrase, and you can check which peer data items you'd like to show on tire computer screen. Also, once you have chosen the data, you can click on a term, and the companies will be ranked in either ascending or descending order for tire specific term selected.
2. Looking at Morningstar's Financial Health ratios, what has happened to HP's financial leverage position over tire past 10 years?
Want to see the full answer?
Check out a sample textbook solution
Chapter 4 Solutions
Fundamentals of Financial Management


- Conducting a Financial Ratio Analysis on HP INC. Use online resources to work on this chapter's questions. Please note that website information changes over time, and these changes may limit your ability to answer some of these questions. In Chapter 3, we looked at Dunkin' Brands' financial statements. In this chapter, we will use financial Internet websites (specifically, www.morningstar.com and www.google.com/finance) to analyze HP Inc., a computer hardware company. Once on either website, you simply enter HP Inc.'s ticker symbol (HPQ) to obtain the financial information needed. The text mentions that financial statement analysis has two major components: a trend analysis, where we evaluate changes in key ratios over time, and a freer analysis, where we compare financial ratios with firms that are in the same industry and/or line of business. We will do both of these types of analysis in this problem. Through the Morningstar website, you can find the firm's financials (Income Statement, Balance Sheet, and Cash Flow) on an annual or quarterly basis for the five most recent time periods. In addition, the site contains Key Ratios (Profitability', Growth, Cash Flow, Financial Health, and Efficiency) for 10 years. We will use the Key Ratios on this site to conduct the firm's trend analysis. (At the bottom of the screen you will see that you can click "Glossary to find definitions for the different ratios. For example, Morningstar's Financial Leverage ratio is the same as the Equity multiplier that we use in the textbook.) On the Google Finance site, you can find the firm's financial statements for the four most recent years or the five most recent quarters and key financial data for related companies for the most recent year or quarter. We will use the related companies' annual data to conduct the firm's peer analysis. Notice that when you go to the "Related Companies" screen, you can "add or remove columns, Click on that phrase, and you can check which peer data items you'd like to show on tire computer screen. Also, once you have chosen the data, you can click on a term, and the companies will be ranked in either ascending or descending order for tire specific term selected. 8. From tire information gained in question 7 and using the DuPont analysis, what are HP's strengths and weaknesses compared to those of its competitors?arrow_forwardConducting a Financial Ratio Analysis on HP INC. Use online resources to work on this chapter's questions. Please note that website information changes over time, and these changes may limit your ability to answer some of these questions. In Chapter 3, we looked at Dunkin' Brands' financial statements. In this chapter, we will use financial Internet websites (specifically, www.morningstar.com and www.google.com/finance) to analyze HP Inc., a computer hardware company. Once on either website, you simply enter HP Inc.'s ticker symbol (HPQ) to obtain the financial information needed. The text mentions that financial statement analysis has two major components: a trend analysis, where we evaluate changes in key ratios over time, and a freer analysis, where we compare financial ratios with firms that are in the same industry and/or line of business. We will do both of these types of analysis in this problem. Through the Morningstar website, you can find the firm's financials (Income Statement, Balance Sheet, and Cash Flow) on an annual or quarterly basis for the five most recent time periods. In addition, the site contains Key Ratios (Profitability, Growth, Cash Flow, Financial Health, and Efficiency) for 10 years. We will use the Key Ratios on this site to conduct the firm's trend analysis. (At the bottom of the screen you will see that you can click "Glossary" to find definitions for the different ratios. For example, Morningstar's Financial Leverage ratio is the same as the Equity multiplier that we use in the textbook.) On the Google Finance site, you can find the firms financial statements for the four most recent years or the five most recent quarters and key financial data for related companies for the most recent year or quarter. We will use the related companies' annual data to conduct the firm's peer analysis. Notice that when you go to the "Related Companies" screen, you can "add or remove columns." Click on that phrase, and you can check which peer data items you'd like to show on tire computer screen. Also, once you have chosen the data, you can click on a term, and the companies will be ranked in either ascending or descending order for the specific term selected. 1. Looking at Morningstar's Financial Health ratios, what has happened to HPs liquidity position over the past 10 years?arrow_forwardConducting a Financial Ratio Analysis on HP INC. Use online resources to work on this chapter's questions. Please note that website information changes over time, and these changes may limit your ability to answer some of these questions. In Chapter 3, we looked at Dunkin' Brands' financial statements. In this chapter, we will use financial Internet websites (specifically, www.morningstar.com and www.google.com / finance) to analyze HP Inc., a computer hardware company. Once on either website, you simply enter HP Inc.'s ticker symbol (HPQ) to obtain the financial information needed. The text mentions that financial statement analysis has two major components: a trend analysis, where we evaluate changes in key ratios over time, and a freer analysis, where we compare financial ratios with firms that are in the same industry and/or line of business. We will do both of these types of analysis in this problem. Through the Morningstar website, you can find the firm's financials (Income Statement, Balance Sheet, and Cash Flow) on an annual or quarterly basis for the five most recent time periods. In addition, the site contains Key Ratios (Profitability, Growth, Cash Flow, Financial Health, and Efficiency) for 10 years. We will use the Key Ratios on this site to conduct the firm's trend analysis. (At the bottom of the screen you will see that you can click "Glossary to find definitions for the different ratios For example, Morningstar's Financial Leverage ratio is the same as the Equity multiplier that we use in the textbook.) On the Google Finance site, you can find the firms financial statements for the four most recent years or the five most recent quarters and key financial data for related companies for the most recent year or quarter. We will use the related companies' annual data to conduct the firm's peer analysis. Notice that when you go to the "Related Companies" screen, you can "add or remove columns." Click on that phrase, and you can check which peer data items you'd like to show on tire computer screen. Also, once you have chosen the data, you can click on a term, and the companies will be ranked in either ascending or descending order for tire specific term selected. 6. From the Google Finance site, look at HP's profitability ratios (as measured by its profit margin, ROA, and ROE). How do these ratios compare with those of its peers?arrow_forward
- Conducting a Financial Ratio Analysis on HP INC. Use online resources to work on this chapter's questions. Please note that website information changes over time, and these changes may limit your ability to answer some of these questions. In Chapter 3, we looked at Dunkin' Brands' financial statements. In this chapter, we will use financial Internet websites (specifically, www.morningstar.com and www.google.com/finance) to analyze HP Inc., a computer hardware company. Once on either website, you simply enter HP Inc.'s ticker symbol (HPQ) to obtain the financial information needed. The text mentions that financial statement analysis has two major components: a trend analysis, where we evaluate changes in key ratios over time, and a peer analysis, where we compare financial ratios with firms that are in the same industry and/or line of business. We will do both of these types of analysis in this problem. Through the Morningstar website, you can find the firm's financials (Income Statement, Balance Sheet, and Cash Flow) on an annual or quarterly basis for the five most recent time periods. In addition, the site contains Key Ratios (Profitability, Growth, Cash Flow, Financial Health, and Efficiency) for 10 years. We will use the Key Ratios on this site to conduct the firm's trend analysis. (At the bottom of the screen you will see that you can click "Glossary" to find definitions for the different ratios. For example, Morningstar's Financial Leverage ratio is the same as the Equity multiplier that we use in the textbook.) On the Google Finance site, you can find the firms financial statements for the four most recent years or the five most recent quarters and key financial data for related companies for the most recent year or quarter. We will use the related companies' annual data to conduct the firm's peer analysis. Notice that when you go to the "Related Companies" screen, you can "add or remove columns." Click on that phrase, and you can check which peer data items you'd like to show on tire computer screen. Also, once you have chosen the data, you can click on a term, and the companies will be ranked in either ascending or descending order for tire specific term selected. 5. From the Google Finance site, look at HP's liquidity position (as measured by its current ratio). How does this ratio compare with those of its peers?arrow_forwardConducting a Financial Ratio Analysis on HP INC. Use online resources to work on this chapter's questions. Please note that website information changes over time, and these changes may limit your ability to answer some of these questions. In Chapter 3, we looked at Dunkin' Brands' financial statements. In this chapter, we will use financial Internet websites (specifically, www.morningstar.com and www.google.com / finance) to analyze HP Inc., a computer hardware company. Once on either website, you simply enter HP Inc.'s ticker symbol (HPQ) to obtain the financial information needed. The text mentions that financial statement analysis has two major components: a trend analysis, where we evaluate changes in key ratios over time, and a peer analysis, where we compare financial ratios with firms that are in the same industry and/or line of business. We will do both of these types of analysis in this problem. Through the Morningstar website, you can find the firm's financials (Income Statement, Balance Sheet, and Cash Flow) on an annual or quarterly basis for the five most recent time periods. In addition, the site contains Key Ratios (Profitability, Growth, Cash Flow, Financial Health, and Efficiency) for 10 years. We will use the Key Ratios on this site to conduct the firm's trend analysis. (At the bottom of the screen you will see that you can click "Glossary" to find definitions for the different ratios. For example, Morningstar's Financial Leverage ratio is the same as the Equity multiplier that we use in the textbook.) On the Google Finance site, you can find the firms financial statements for the four most recent years or the five most recent quarters and key financial data for related companies for the most recent year or quarter. We will use the related companies' annual data to conduct the firm's peer analysis. Notice that when you go to the "Related Companies" screen, you can "add or remove columns." Click on that phrase, and you can check which peer data items you'd like to show on tire computer screen. Also, once you have chosen the data, you can click on a term, and the companies will be ranked in either ascending or descending order for the specific term selected. 4. Identify Google Finance's list of related companies to HP. Which is the largest in terms of market capitalization? Which is the smallest? Where does HT rank (in terms of market capitalization)?arrow_forwardWho will be a user of financial statements, and what will they be used for? Question 17 options: Lenders will use financial statements to decide whether to invest in a company. Investors will use financial statements to decide whether to lend money to a company. The marketing department is interested in the operating income figures in the financial statements. Managers will use financial statements to make decisions about their company.arrow_forward
- Indicate whether each of the following companies is primarily a service, merchandies, or manufacturing business. If you are unfamiliar with the company, you may use the internet to locate the company's home page or use the finance web site of Yahoo.comarrow_forwardUse the internet to research one manufacturing, one retail (or merchandising), and one service business. For each business, describe the following:Your answer:A. the primary purpose of the entityB. the types of activities that accountants would record (hint: what is the source of the business’ funding, and what costs might the business have?)C. the types of decisions that might be made in this organization and how financial and nonfinancial information might help the decision-making processarrow_forwardCompare Amazon.com to Best Buy Amazon.com, Inc. (AMZN) is one of the largest Internet retailers in the world. We will use Amazon as a continuing company exercise to reinforce the various tools and techniques for analyzing financial statements. We will begin with the ratio of liabilities to stockholders' equity. Ratios can be used to compare companies in the same industry. For Amazon, there are a number of competitors that sell media, electronic, and other merchandise. Best Buy, Inc. (BBY) is one such company. The following total liabilities and stockholders' equity information (in millions) is provided for Amazon and Best Buy for the end of a recent year: Total assets Total liabilities Total stockholders' equity a. Compute the ratio of liabilities to stockholders' equity for each company. Round to two decimal places. Amazon Best Buy $420,549 $19,067 282,304 14,480 138,245 4,587 Liabilities to stockholders' equity ratio Amazon Best Buy b. Which of the following indicates the level of…arrow_forward
- XYZ is considering the option to invest excess cash in short-term financial instruments. XYZ wishes to have access to the investments as quickly as possible in order to pay bills and meet employee payroll and have a return on their investment. Briefly discuss which factors you would be focusing on under each of the six (6) steps. Briefly describe the research tools available including the CCH Answer Connect and CCH Accounting Research.arrow_forwardCreate a financial statement for your hypothetical new business venture. Using the attached Excel template, and based on surveying a specific market place, make a best-guess estimated statement exhibiting profit and loss. In business, accuracy counts, so make sure to check and recheck your numbers before submitting your financial statements. Your grade will be based on the completeness and accuracy of the Income Statement. This is all of the information that I have. The hypothetical business is for a residential moving company.arrow_forwardUse the internet to research one manufacturing, one retail (or merchandising), and one service business. For each business, describe the following: A. the primary purpose of the entity B. the types of activities that accountants would record (hint: what is the source of the business funding, and what costs might the business have?) C. the types of decisions that might be made in this organization and how financial and nonfinancial information might help the decision-making processarrow_forward
 Fundamentals of Financial Management (MindTap Cou...FinanceISBN:9781285867977Author:Eugene F. Brigham, Joel F. HoustonPublisher:Cengage Learning
 Fundamentals of Financial Management (MindTap Cou...FinanceISBN:9781337395250Author:Eugene F. Brigham, Joel F. HoustonPublisher:Cengage Learning
 Financial AccountingAccountingISBN:9781337272124Author:Carl Warren, James M. Reeve, Jonathan DuchacPublisher:Cengage Learning
 Principles of Accounting Volume 1AccountingISBN:9781947172685Author:OpenStaxPublisher:OpenStax College
 College Accounting, Chapters 1-27AccountingISBN:9781337794756Author:HEINTZ, James A.Publisher:Cengage Learning,
 Pkg Acc Infor Systems MS VISIO CDFinanceISBN:9781133935940Author:Ulric J. GelinasPublisher:CENGAGE L