Videos
Consider the market for minivans. For each of the events listed here, identify which of the determinants of
a. People decide to have more children.
b. A strike by steelworkers raises steel prices.
c. Engineers develop new automated machinery for the production of minivans.
d. The price of sports utility vehicles rises.
e. A stock market crash lowers people’s wealth.
Subpart (a):
Demand and supply, its determinants and its effect on price and quantity.
Explanation of Solution
Figure 1 illustrates the change in equilibrium due to shift in the demand curve.
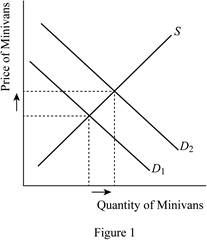
If people decide to have more children, then they would require larger vehicles for transporting their kids around. This results in an increase in the demand for minivan, while the supply curve remains unaffected. The result is a rise in both the price and the quantity sold. Figure 1 illustrates shift in the demand curve of minivans due to the increased children. The vertical axis represents the price of minivans and the horizontal axis represents the quantity demanded and supplied of minivans. The rightward shift of demand curve causes an increase in both the equilibrium quantity and price of minivans.
Concept Introduction:
Quantity demanded: It is the amount of a good that buyers are willing and able to purchase in the market.
Demand curve: It shows how the quantity of a good demanded depends on the price.
Supply curve: It shows how the quantity of a good supplied depends on the price.
Quantity supplied: It is the amount of a good that sellers are willing and able to sell in the market.
Substitutes: Two goods are considered substitutes if an increase in the price of one good lead to an increase in the demand for the other.
Equilibrium price: It is the price at which the quantity demanded of a good or service is equal to the quantity supplied.
Subpart (b):
Demand and supply, its determinants and its effect on price and quantity.
Explanation of Solution
Figure 2 illustrates the change in equilibrium due to shift in the supply curve.
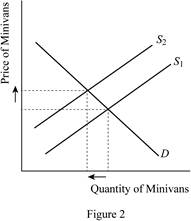
Figure 2 illustrates the change in demand and supply of minivans when the price of steel rises. The vertical axis represents the price of minivans and the horizontal axis represents the quantity demanded and supplied of minivans. From Figure 2, it can be inferred that when the price of steel rises as a result of strike by steelworkers, the supply curve of minivans shifts leftwards because an increase in steel price is an increase in cost of producing a minivan. But there will be no shift in demand curve. The leftward shift of supply curve causes a decline in the equilibrium quantity sold with a rise in the equilibrium price of minivans.
Concept Introduction:
Quantity demanded: It is the amount of a good that buyers are willing and able to purchase in the market.
Demand curve: It shows how the quantity of a good demanded depends on the price.
Supply curve: It shows how the quantity of a good supplied depends on the price.
Quantity supplied: It is the amount of a good that sellers are willing and able to sell in the market.
Substitutes: Two goods are considered substitutes if an increase in the price of one good lead to an increase in the demand for the other.
Equilibrium price: It is the price at which the quantity demanded of a good or service is equal to the quantity supplied.
Subpart (c):
Demand and supply, its determinants and its effect on price and quantity.
Explanation of Solution
Figure 3 illustrates the change in equilibrium due to shift in the supply curve.
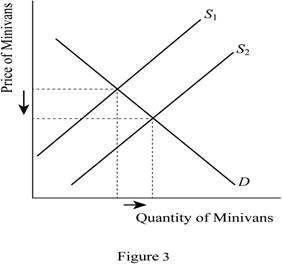
The development of new automated machinery for the production of minivans increases the supply of minivans with a reduction in its cost of production due to improved technology. This is illustrated in Figure 3, where the horizontal axis represents the quantity demanded and supplied of minivans, while the vertical axis represents the price. This reduction in firms' costs will result in an increase in supply causing it to shift to the right; but the demand remains unaffected. The eventual result is a decline in the equilibrium price of minivans and an increase in the quantity sold.
Concept Introduction:
Quantity demanded: It is the amount of a good that buyers are willing and able to purchase in the market.
Demand curve: It shows how the quantity of a good demanded depends on the price.
Supply curve: It shows how the quantity of a good supplied depends on the price.
Quantity supplied: It is the amount of a good that sellers are willing and able to sell in the market.
Substitutes: Two goods are considered substitutes if an increase in the price of one good lead to an increase in the demand for the other.
Equilibrium price: It is the price at which the quantity demanded of a good or service is equal to the quantity supplied.
Subpart (d):
Demand and supply, its determinants and its effect on price and quantity.
Explanation of Solution
Figure 4 illustrates the change in equilibrium due to shift in the supply curve.
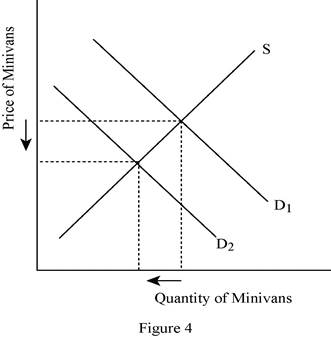
The rise in the price of sport utility vehicles affects the demand of minivans because sport utility vehicles are the substitutes for minivans. This is illustrated in Figure 4 where the vertical axis represents the price of minivans and the horizontal axis represents the quantity demanded and supplied of minivans. From Figure 4, it can be inferred that when the price of sport utility vehicles rise, the demand for minivans increases, since they are substitutes. This result in shift of demand curve rightwards because the higher price of sport utility vehicles will lead consumers to buy more minivans, but there will be no shift in the supply. The rightward shift of demand curve increases both the equilibrium price and equilibrium quantity of minivans.
Concept Introduction:
Quantity demanded: It is the amount of a good that buyers are willing and able to purchase in the market.
Demand curve: It shows how the quantity of a good demanded depends on the price.
Supply curve: It shows how the quantity of a good supplied depends on the price.
Quantity supplied: It is the amount of a good that sellers are willing and able to sell in the market.
Substitutes: Two goods are considered substitutes if an increase in the price of one good lead to an increase in the demand for the other.
Equilibrium price: It is the price at which the quantity demanded of a good or service is equal to the quantity supplied.
Subpart (e):
Demand and supply, its determinants and its effect on price and quantity.
Explanation of Solution
Figure 5 illustrates the change in equilibrium due to shift in the supply curve.
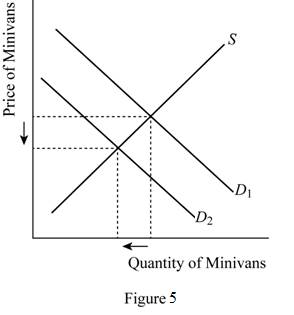
The stock market crash reduces the wealth of people, which in turn reduces their income. This reduces the demand of minivans because minivans are likely a normal good. This is illustrated in Figure 5 where the vertical axis represents the price of minivans and the horizontal axis represents the quantity demanded and supplied of minivans. From Figure 5, it can be inferred that when the income falls, the demand for minivans decreases since they are resulting in shift of demand curve leftwards, but there will be no shift in supply. The leftward shift of demand curve reduces both the equilibrium price and equilibrium quantity of minivans.
Concept Introduction:
Quantity demanded: It is the amount of a good that buyers are willing and able to purchase in the market.
Demand curve: It shows how the quantity of a good demanded depends on the price.
Supply curve: It shows how the quantity of a good supplied depends on the price.
Quantity supplied: It is the amount of a good that sellers are willing and able to sell in the market.
Substitutes: Two goods are considered substitutes if an increase in the price of one good lead to an increase in the demand for the other.
Equilibrium price: It is the price at which the quantity demanded of a good or service is equal to the quantity supplied.
Want to see more full solutions like this?
Chapter 4 Solutions
Brief Principles of Macroeconomics (MindTap Course List)


- The computer market in recent years has seen many more computing sell at much lower prices. What shift in demand or supply is most likely to explain this outcome? Sketch a demand and supply diagram and explain your reasoning for each. A rise in demand A fall in demand A rise in supply A fall in supplyarrow_forwardMany changes are affecting the market for oil. Predict how each of the following events will affect the equilibrium price and quantity in the market for oil. In each case, state how the event will affect the supply and demand diagram. Create a sketch of the diagram if necessary. Cars are becoming more fuel efficient, and therefore get more miles to the gallon. The winter is exceptionally cold. A major discovery of new oil is made off the coast of Norway. The economies of some major oil-using nations, like Japan, slow down. A war in the Middle East disrupts oil-pumping schedules. Landlords install additional insulation in buildings. The price of solar energy falls dramatically. Chemical companies invent a new, popular kind of plastic made from oil.arrow_forwardThe following table summarizes information about the market for principles of economics textbooks: Price Quantity Demanded per Year Quantity Supplied per Year $45 4,300 300 55 2,300 700 65 1,300 1,300 75 800 2,100 85 650 3,100 What is the market equilibrium price and quantity of textbooks? To quell outrage over tuition increases, the college places a $55 limit on the price of textbooks. How many textbooks will be sold now? While the price limit is still in effect, automated publishing increases the efficiency of textbook production. Show graphically the likely effect of this innovation on the market price and quantity.arrow_forward
 Essentials of Economics (MindTap Course List)EconomicsISBN:9781337091992Author:N. Gregory MankiwPublisher:Cengage Learning
 Brief Principles of Macroeconomics (MindTap Cours...EconomicsISBN:9781337091985Author:N. Gregory MankiwPublisher:Cengage Learning
 Principles of MicroeconomicsEconomicsISBN:9781305156050Author:N. Gregory MankiwPublisher:Cengage Learning
 Exploring EconomicsEconomicsISBN:9781544336329Author:Robert L. SextonPublisher:SAGE Publications, Inc
