
TRIGONOMETRY (LL) W/ACCESS
11th Edition
ISBN: 9780135998472
Author: Lial
Publisher: PEARSON
expand_more
expand_more
format_list_bulleted
Concept explainers
Videos
Question
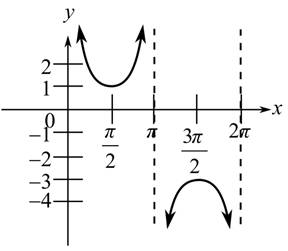
Chapter 4, Problem 48RE
To determine
An equation from the given graph.
Expert Solution & Answer
Want to see the full answer?
Check out a sample textbook solution
Students have asked these similar questions
Graphing cosecant functions:
y=2csc(2(x-pi/2))+2
(i) Period, (ii) Amplitude, (iii) y-intercept, (iv) Phase Shift, (v) Vertical Shift.
(b) Graph f(x). You must show at least one period and label all intercepts.
What is the phase shift,min,max, and how do you graph, as well as factoring out b from the equation: f(x) = 3sec(3x-pi/2)+2
Chapter 4 Solutions
TRIGONOMETRY (LL) W/ACCESS
Ch. 4.1 - CONCEPT PREVIEW Fill in the blank(s) to correctly...Ch. 4.1 -
CONCEPT PREVIEW Fill in the blank(s) to correctly...Ch. 4.1 - CONCEPT PREVIEW Fill in the blank(s) to correctly...Ch. 4.1 - CONCEPT PREVIEW Fill in the blank(s) to correctly...Ch. 4.1 -
5. The least positive number x for which cos x =...Ch. 4.1 - CONCEPT PREVIEW Fill in the blank(s) to correctly...Ch. 4.1 - Concept Check Match each function with its graph...Ch. 4.1 - Concept Check Match each function with its graph...Ch. 4.1 -
Concept Check Match each function with its graph...Ch. 4.1 - Concept Check Match each function with its graph...
Ch. 4.1 - Concept Check Match each function with its graph...Ch. 4.1 - Concept Check Match each function with its graph...Ch. 4.1 -
Graph each function over the interval [ –2π, 2π]....Ch. 4.1 - Graph each function over the interval [ 2, 2]....Ch. 4.1 - Graph each function over the interval [2, 2]. Give...Ch. 4.1 -
Graph each function over the interval [–2π, 2π]....Ch. 4.1 - Graph each function over the interval [2,2]. Give...Ch. 4.1 -
Graph each function over the interval [–2π,2π]....Ch. 4.1 -
Graph each function over the interval [–2 π,2π]....Ch. 4.1 - Graph each function over the interval [–2π,2π]....Ch. 4.1 - Graph each function over the interval [2,2 ]. Give...Ch. 4.1 - Prob. 22ECh. 4.1 - Graph each function over a two-period interval....Ch. 4.1 -
Graph each function over a two-period interval....Ch. 4.1 -
Graph each function over a two-period interval....Ch. 4.1 - Graph each function over a two-period interval....Ch. 4.1 - Graph each function over a two-period interval....Ch. 4.1 - Graph each function over a two-period interval....Ch. 4.1 - Graph each function over a two-period interval....Ch. 4.1 -
Graph each function over a two-period interval....Ch. 4.1 - Graph each function over a two-period interval....Ch. 4.1 -
Graph each function over a two-period interval....Ch. 4.1 - Graph each function over a two-period interval....Ch. 4.1 -
Graph each function over a two-period interval....Ch. 4.1 -
Graph each function over a two-period interval....Ch. 4.1 -
Graph each function over a two-period interval....Ch. 4.1 -
Graph each function over a two-period interval....Ch. 4.1 -
Graph each function over a two-period interval....Ch. 4.1 - Graph each function over a two-period interval....Ch. 4.1 - Graph each function over a two-period interval....Ch. 4.1 - Connecting Graphs with Equations Determine an...Ch. 4.1 - Connecting Graphs with Equations Determine an...Ch. 4.1 - Connecting Graphs with Equations Determine an...Ch. 4.1 - Connecting Graphs with Equations Determine an...Ch. 4.1 - Connecting Graphs with Equations Determine an...Ch. 4.1 - Connecting Graphs with Equations Determine an...Ch. 4.1 - Average Annual Temperature Scientists believe that...Ch. 4.1 - Blood Pressure Variation The graph gives the...Ch. 4.1 - Prob. 49ECh. 4.1 - Prob. 50ECh. 4.1 - Prob. 51ECh. 4.1 - Prob. 52ECh. 4.1 - Prob. 53ECh. 4.1 - Activity of a Nocturnal Animal Many activities of...Ch. 4.1 -
55. Atmospheric Carbon Dioxide At Mauna Loa....Ch. 4.1 - Atmospheric Carbon Dioxide Refer to Exercise 55....Ch. 4.1 -
57. Average Daily Temperature The temperature in...Ch. 4.1 - 58. Fluctuation in the Solar Constant The solar...Ch. 4.1 -
Musical Sound Waves Pure sounds produce single...Ch. 4.1 - Musical Sound Waves Pure sounds produce single...Ch. 4.1 - Prob. 61ECh. 4.1 - Prob. 62ECh. 4.1 - Prob. 63ECh. 4.1 - Prob. 64ECh. 4.1 - Prob. 65ECh. 4.1 - Prob. 66ECh. 4.2 - CONCEPT PREVIEW Fill in the blank(s) to correctly...Ch. 4.2 - CONCEPT PREVIEW Fill in the blank(s) to correctly...Ch. 4.2 - CONCEPT PREVIEW Fill in the blanks to correctly...Ch. 4.2 - CONCEPT PREVIEW Fill in the blanks to correctly...Ch. 4.2 -
CONCEPT PREVIEW Fill in the blank(s) to correctly...Ch. 4.2 - CONCEPT PREVIEW Fill in the blank(s) to correctly...Ch. 4.2 -
CONCEPT PREVIEW Fill in the blank(s) to correctly...Ch. 4.2 - CONCEPT PREVIEW Fill in the blanks to correctly...Ch. 4.2 - Concept Check Match each function with its graph...Ch. 4.2 - Concept Check Match each function with its graph...Ch. 4.2 - Concept Check Match each function w ith its graph...Ch. 4.2 - Concept Check Match each function w ith its graph...Ch. 4.2 - Concept Check Match each function with its graph...Ch. 4.2 - Concept Check Match each function with its graph...Ch. 4.2 - Concept Check Match each function with its graph...Ch. 4.2 - Concept Check Match each function with its graph...Ch. 4.2 - The graphs of y = sin x + 1 and y = sin(x + 1) are...Ch. 4.2 - Concept Check Refer to Exercise 17. Which one of...Ch. 4.2 -
Concept Check Match each function in Column I...Ch. 4.2 - Concept Check Match each function in Column I with...Ch. 4.2 -
Concept Check Match each function in Column I...Ch. 4.2 - Concept Check Match each function in Column I with...Ch. 4.2 - Concept Check Fill in each blank with the word...Ch. 4.2 - Prob. 24ECh. 4.2 - Connecting Graphs with equations Each function...Ch. 4.2 - Connecting Graphs with Equations Each function...Ch. 4.2 -
Connecting Graphs with Equations Each function...Ch. 4.2 - Prob. 28ECh. 4.2 -
Find the amplitude, the period, any vertical...Ch. 4.2 -
Find the amplitude, the period, any vertical...Ch. 4.2 -
Find the amplitude, the period, any vertical...Ch. 4.2 -
Find the amplitude, the period, any vertical...Ch. 4.2 - Find the amplitude, the period, any vertical...Ch. 4.2 -
Find the amplitude, the period, any vertical...Ch. 4.2 - Find the amplitude, the period, any vertical...Ch. 4.2 - Find the amplitude, the period, any vertical...Ch. 4.2 - Graph each function over a two-period interval....Ch. 4.2 - Graph each function over a two-period interval....Ch. 4.2 - Graph each function over a two-period interval....Ch. 4.2 - Graph each function over a two-period interval....Ch. 4.2 -
Graph each function over a two-period interval....Ch. 4.2 - Graph each function over a two-period interval....Ch. 4.2 -
Graph each function over a one-period interval....Ch. 4.2 -
Graph each function over a one-period interval....Ch. 4.2 - Graph each function over a one-period interval....Ch. 4.2 - Graph each function over a one-period interval....Ch. 4.2 - Graph each function over a one-period interval....Ch. 4.2 -
Graph each function over a one-period interval....Ch. 4.2 - Graph each function over a two-period interval....Ch. 4.2 - Graph each function over a two-period interval....Ch. 4.2 -
Graph each function over a two-period interval....Ch. 4.2 -
Graph each function over a two-period interval....Ch. 4.2 - Graph each function over a two-period interval....Ch. 4.2 -
Graph each function over a two-period interval....Ch. 4.2 -
Graph each function over a two-period interval....Ch. 4.2 - Graph each function over a two-period interval....Ch. 4.2 -
Graph each function over a two-period interval....Ch. 4.2 - Graph each function over a one-period interval....Ch. 4.2 -
Graph each function over a one-period interval....Ch. 4.2 - Prob. 60ECh. 4.2 - Average Monthly Temperature The average monthly...Ch. 4.2 - Prob. 62ECh. 4.2 - Prob. 63ECh. 4.2 - Prob. 64ECh. 4.2 - Prob. 65ECh. 4.2 - Prob. 66ECh. 4.2 - Prob. 1QCh. 4.2 - Graph each function over a two-period interval....Ch. 4.2 - Prob. 3QCh. 4.2 - Prob. 4QCh. 4.2 - Prob. 5QCh. 4.2 - Graph each function over a two-period interval....Ch. 4.2 - Prob. 7QCh. 4.2 - Prob. 8QCh. 4.2 - Prob. 9QCh. 4.2 - Prob. 10QCh. 4.2 - Prob. 11QCh. 4.2 - Prob. 12QCh. 4.3 - 1. The least positive value x for which tan x = 0...Ch. 4.3 - The least positive value x for which cot x = 0 is...Ch. 4.3 - Concept Check Fill in each blank with the word...Ch. 4.3 - Concept Check Fill in each blank with the word...Ch. 4.3 - The negative value k with the greatest value for...Ch. 4.3 - CONCEPT PREVIEW Fill in the blank(s) to correctly...Ch. 4.3 - Concept Check Match each function with its graph...Ch. 4.3 - Concept Check Match each function with its graph...Ch. 4.3 -
Concept Check Match each function with its...Ch. 4.3 - Concept Check Match each function with its graph...Ch. 4.3 - Concept CheckMatch each function with its graph...Ch. 4.3 - Concept Check Match each function with its graph...Ch. 4.3 - Graph each function over a one-period interval....Ch. 4.3 -
Graph each function over a one-period interval....Ch. 4.3 - Graph each function over a one-period interval....Ch. 4.3 - Graph each function over a one-period interval....Ch. 4.3 - Graph each function over a one-period interval....Ch. 4.3 - Graph each function over a one-period interval....Ch. 4.3 - Graph each function over a one-period interval....Ch. 4.3 - Graph each function over a one-period interval....Ch. 4.3 -
Graph each function over a one-period...Ch. 4.3 - Graph each function over a one-period interval....Ch. 4.3 - Graph each function over a one-period interval....Ch. 4.3 -
Graph each function over a one-period interval....Ch. 4.3 - Graph each function over a two-period interval....Ch. 4.3 -
Graph each function over a two-period interval....Ch. 4.3 -
Graph each function over a two-period...Ch. 4.3 -
Graph each function over a two-period...Ch. 4.3 - Graph each function over a two-period interval....Ch. 4.3 - Graph each function over a two-period interval....Ch. 4.3 - Prob. 31ECh. 4.3 - Graph each function over a two-period interval....Ch. 4.3 - Graph each function over a two-period interval....Ch. 4.3 - Prob. 34ECh. 4.3 - Graph each function over a two-period interval....Ch. 4.3 - Prob. 36ECh. 4.3 - Graph each function over a two-period interval....Ch. 4.3 - Prob. 38ECh. 4.3 - Prob. 39ECh. 4.3 - Prob. 40ECh. 4.3 - Prob. 41ECh. 4.3 - Prob. 42ECh. 4.3 - Prob. 43ECh. 4.3 - Prob. 44ECh. 4.3 - Concept Check Decide whether each statement is...Ch. 4.3 - Concept CheckDecide whether each statement is true...Ch. 4.3 -
Concept Check Decide whether each statement is...Ch. 4.3 - Prob. 48ECh. 4.3 - Concept Check If c is any number, then how many...Ch. 4.3 - Prob. 50ECh. 4.3 - 51. Show that tan(–x) = –tan x by writing tan(–x)...Ch. 4.3 - 52. Show that cot (–x) = –cot x by writing cot...Ch. 4.3 - Prob. 53ECh. 4.3 - Prob. 54ECh. 4.3 - Prob. 55ECh. 4.3 - Prob. 56ECh. 4.3 - Prob. 57ECh. 4.3 - Prob. 58ECh. 4.3 - Prob. 59ECh. 4.3 - Prob. 60ECh. 4.3 - Prob. 61ECh. 4.3 - Prob. 62ECh. 4.4 - CONCEPT PREVIEW Match each description in Column I...Ch. 4.4 -
CONCEPT PREVIEW Match each description in...Ch. 4.4 -
CONCEPT PREVIEW Match each description in Column...Ch. 4.4 -
CONCEPT PREVIEW Match each description in Column...Ch. 4.4 -
CONCEPT PREVIEW Match each description in Column...Ch. 4.4 -
CONCEPT PREVIEW Match each description in Column...Ch. 4.4 - Concept Check Match each function with its graph...Ch. 4.4 - Concept Check Match each function with its graph...Ch. 4.4 - Concept Check Match each function with its graph...Ch. 4.4 - Concept Check Match each function with its graph...Ch. 4.4 - Graph each function over a one-period interval....Ch. 4.4 - Graph each function over a one-period interval....Ch. 4.4 - Graph each function over a one-period interval....Ch. 4.4 - Graph each function over a one-period interval....Ch. 4.4 -
Graph each function over a one-period interval....Ch. 4.4 - Graph each function over a one-period interval....Ch. 4.4 - Graph each function over a one-period interval....Ch. 4.4 - Graph each function over a one-period interval....Ch. 4.4 - Graph each function over a one-period interval....Ch. 4.4 - Graph each function over a one-period interval....Ch. 4.4 - Graph each function over a one-period interval....Ch. 4.4 - Graph each function over a one-period interval....Ch. 4.4 - Graph each function over a one-period interval....Ch. 4.4 - Graph each function over a one-period interval....Ch. 4.4 - Connecting Graphs with EquationsDetermine an...Ch. 4.4 - Connecting Graphs with Equations Determine an...Ch. 4.4 - Connecting Graphs with Equations Determine an...Ch. 4.4 - Connecting Graphs with Equations Determine an...Ch. 4.4 - Connecting Graphs with Equations Determine an...Ch. 4.4 - Prob. 30ECh. 4.4 - Concept CheckDecide whether each statement is true...Ch. 4.4 - Concept Check Decide whether each statement is...Ch. 4.4 - Concept CheckDecide whether each statement is true...Ch. 4.4 - Prob. 34ECh. 4.4 - 35. Concept Check If c is any number such that -1...Ch. 4.4 - Prob. 36ECh. 4.4 - 37. Show that sec (–x) = sec x by writing sec (–x)...Ch. 4.4 - Prob. 38ECh. 4.4 - Prob. 39ECh. 4.4 - (Modeling) Distance of a Rotating Beacon The...Ch. 4.4 - Prob. 41ECh. 4.4 - Prob. 42ECh. 4.4 - Prob. 43ECh. 4.4 - Prob. 44ECh. 4.4 - Prob. 45ECh. 4.4 - Prob. 46ECh. 4.4 - Prob. 1SECh. 4.4 - Prob. 2SECh. 4.4 - These summary exercises provide practice with the...Ch. 4.4 - Prob. 4SECh. 4.4 - Prob. 5SECh. 4.4 - Prob. 6SECh. 4.4 - Prob. 7SECh. 4.4 -
Graph each function over a two-period...Ch. 4.4 - Prob. 9SECh. 4.4 - Graph each function over a two-period...Ch. 4.5 - CONCEPT PREVIEW Refer to the equations in the...Ch. 4.5 - Prob. 2ECh. 4.5 - CONCEPT PREVIEW Refer to the equations in the...Ch. 4.5 - Prob. 4ECh. 4.5 - Prob. 5ECh. 4.5 - Prob. 6ECh. 4.5 - Spring Motion An object is attached to a coiled...Ch. 4.5 - Spring Motion Repeat Exercise 7, but assume that...Ch. 4.5 - 9. Voltage of an Electrical Circuit The voltage E...Ch. 4.5 - Prob. 10ECh. 4.5 - Particle Movement Write the equation and then...Ch. 4.5 - Prob. 12ECh. 4.5 -
13. Pendulum Motion What are the period P and...Ch. 4.5 - Prob. 14ECh. 4.5 - Spring Motion The formula for the up and down...Ch. 4.5 - Spring Motion (See Exercise 15.) A spring with...Ch. 4.5 - Spring Motion The position of a weight attached to...Ch. 4.5 - Spring Motion The position of a weight attached to...Ch. 4.5 - Spring Motion A weight attached to a spring is...Ch. 4.5 -
20. Spring Motion A weight attached to a spring...Ch. 4.5 -
(Modeling) Springs A weight on a spring has...Ch. 4.5 - Prob. 22ECh. 4.5 -
(Modeling) Springs A weight on a spring has...Ch. 4.5 -
(Modeling) Springs A weight on a spring has...Ch. 4.5 - Prob. 25ECh. 4.5 - Prob. 26ECh. 4.5 - Prob. 27ECh. 4.5 - Prob. 28ECh. 4.5 -
(Modeling) Spring Motion Consider the spring in...Ch. 4.5 - Prob. 30ECh. 4.5 - Prob. 31ECh. 4.5 - (Modeling) Spring Motion Consider the spring in...Ch. 4.5 - Prob. 33ECh. 4.5 - Prob. 34ECh. 4 - Concept Check Which one of the following...Ch. 4 - Prob. 2RECh. 4 - Prob. 3RECh. 4 - Prob. 4RECh. 4 - Prob. 5RECh. 4 - Prob. 6RECh. 4 - Prob. 7RECh. 4 - Prob. 8RECh. 4 -
For each function, give the amplitude, period,...Ch. 4 - Prob. 10RECh. 4 - Prob. 11RECh. 4 - Prob. 12RECh. 4 - Prob. 13RECh. 4 -
For each function, give the amplitude, period,...Ch. 4 - Prob. 15RECh. 4 - Prob. 16RECh. 4 - Prob. 17RECh. 4 - Prob. 18RECh. 4 - Prob. 19RECh. 4 - Prob. 20RECh. 4 - Prob. 21RECh. 4 - Prob. 22RECh. 4 - Prob. 23RECh. 4 - Prob. 24RECh. 4 - Prob. 25RECh. 4 - Prob. 26RECh. 4 - Prob. 27RECh. 4 - Prob. 28RECh. 4 - Prob. 29RECh. 4 - Prob. 30RECh. 4 - Prob. 31RECh. 4 - Prob. 32RECh. 4 - Graph each function over a one-period...Ch. 4 -
Graph each function over a one-period...Ch. 4 -
Graph each function over a one-period...Ch. 4 - Prob. 36RECh. 4 -
Graph each function over a one-period...Ch. 4 - Prob. 38RECh. 4 - Prob. 39RECh. 4 - Prob. 40RECh. 4 - Prob. 41RECh. 4 - Prob. 42RECh. 4 - (Modeling) Monthly Temperatures A set of...Ch. 4 - Prob. 44RECh. 4 - Prob. 45RECh. 4 - Prob. 46RECh. 4 - Prob. 47RECh. 4 - Prob. 48RECh. 4 - Prob. 49RECh. 4 - Prob. 50RECh. 4 - Prob. 51RECh. 4 - Prob. 52RECh. 4 - Prob. 53RECh. 4 - Prob. 54RECh. 4 - Prob. 55RECh. 4 - Prob. 56RECh. 4 - Prob. 57RECh. 4 - Prob. 58RECh. 4 - Prob. 1TCh. 4 - Prob. 2TCh. 4 - Prob. 3TCh. 4 - Prob. 4TCh. 4 - Prob. 5TCh. 4 - Prob. 6TCh. 4 - Prob. 7TCh. 4 - Prob. 8TCh. 4 - Prob. 9TCh. 4 - Prob. 10TCh. 4 - Prob. 11TCh. 4 - Prob. 12TCh. 4 - Average Monthly Temperature The average monthly...Ch. 4 -
14. Spring Motion The position of a weight...Ch. 4 - Prob. 15T
Knowledge Booster


Learn more about
Need a deep-dive on the concept behind this application? Look no further. Learn more about this topic, trigonometry and related others by exploring similar questions and additional content below.Similar questions
- Find an equation for the graph shown to the right. Type the equation in the form y=Asin(ωx) or y=Acos(ωx). y= ___________arrow_forwardA science class experiment changing the temperature of an object by a constant rate over a period of time. The experiment began with a termperature of -10°F and ended after 8 minutes at a temperature of 0°F Which graph represents the same relationship between temperature, Y, and time, x?arrow_forwardA Cup of Cofee The temperature C of a fresh cup of coffee t minutes after it is poured is given by C = 125e-0.03t 75 degree Fahrenheit. a. Make a graph of Cversus t. b. The coffee is cool enough to drink when its temperature if 150 degrees. When will the coffee be cool enough to drink? c. What is the temperature of the coffee in the pot? Note :We are assuming that the coffee pot is being kept hot and its the same temperature as the cup of coffee when it was poured. d.What is the temperature in the room where you are drinking the coffee? Hint: If the coffee is left to cool a long time, it will reach room temperature.arrow_forward
- Depreciation A hospital purchases a new magnetic resonance imaging (MRI) machine for $1.2 million. The depreciated value y (reduced value) after t years is given by y=1,200,00080,000t,0t10. Sketch the graph of the equation.arrow_forwardPopulation Statistics The table shows the life expectancies of a child (at birth) in the United States for selected years from 1940 through 2010. A model for the life expectancy during this period is y=63.6+0.97t1+0.01t,0t70 Where y represents the life expectancy and t is the time in years, with t = 0 corresponding to 1940. (a) Use a graphing utility to graph the data from the table and the model in the same viewing window. How well does the model fit the data? Explain. (b) Determine the life expectancy in 1990 both graphically and algebraically. (c) Use the graph to determine the year when life expectancy was approximately 70.1. verify your answer algebraically. (d) Find the y-intercept of the graph of the model. What does it represent in the context of the problem? (e) Do you think this model can be used to predict the life expectancy of a child 50 years from now?arrow_forwardA model that can predict a child’s height H (in centimeters) based on the child’s age is H=70.228+5.104x+9.222lnx,14x6 where x is the child’s age in years. (a) Construct a table of values for the model. Then sketch the graph of the model. (b) Use the graph from part (a) to predict the height of a four-year-old child. Then confirm your prediction algebraically.arrow_forward
- Fuel Consumption The daily consumption C (in gallons) of diesel fuel on a farm is modeled by C=30.3+21.6sin2t365+10.9 where t is the time (in days), with t=1 corresponding to January 1. (a) What is the period of the model? Is it what you expected? Explain. (b) What is the average daily fuel consumption? Which value in the model did you use? Explain. (c) Use a graphing utility to graph the model. Use the graph to approximate the time of the year when consumption exceeds 40 gallons per day.arrow_forwardWorld Crude Oil Production In 1956, M.King Hubbert proposed a model to analyse crude oil production. His model, with updated data, gives world crude oil production as P=254.43e0.042t(1+2.12e0.042t)2 Here P is measured in billions of barrels per year, and t is time, in year, since 2000. a.Make a graph of world crude oil production for 2000 through 2040. b.When does this model predict a peak in world crude oil production? c.What is the maximum crude oil production predicted by this model?arrow_forwardMonthly Payment for a Home: If you borrow 120,000 at an APR of 6 in order to buy a home, and if the lending institution compounds interest continuously, then your monthly payment M=M(Y), in dollars, depends on the number of years Y you take to pay off the loan. The relationship is given by M=120,000(e0.0051)1e0.06Y. a. Make a graph of M versus Y. in choosing a graphing window, you should note that a home mortgage rarely extends beyond 30 years. b. Express in functional notation your monthly payment if you pay off the loan in 20 years, and then use the graph to find that value. c. Use the graph to find your monthly payment if you pay off the loan in 30 years. d. From part b to part c of this exercise, you increased the debt period by 50. Did this decrease your monthly payment by 50? e. Is the graph concave up or concave down? Explain your answer in practical terms. f. Calculate the average decreases per year in your monthly payment from a loan period of 25 to a loan period of 30 years.arrow_forward
- Oscillation of a Spring A ball that is bobbing up and down on the end of a spring has a maximum displacement of 3 inches. Its motion (in ideal conditions) is modeled by y=14cos16t,t0, where y is measured in feet and t is the time in seconds. (a) Graph the function. (b) What is the period of the oscillations? (c) Determine the first time the weight passes the point of equilibrium y=0.arrow_forwardThe curve in the graph above is the graph of a sinusoidal function. It goes through the points (-6,0) and (4,0). Find a sinusoidal function that matches the given graph.arrow_forwardA Ferris wheel is 20 meters in diameter and boarded from a platform that is 1 meter above the ground. The six o’clock position on the Ferris wheel is level with the loading platform. The wheel completes 1 full revolution in 16 minutes. The function h(t) gives a person’s height in meters above the ground t minutes after the wheel begins to turn. how to find phase shift and write the equation for hightarrow_forward
arrow_back_ios
arrow_forward_ios
Recommended textbooks for you
 Algebra and Trigonometry (MindTap Course List)AlgebraISBN:9781305071742Author:James Stewart, Lothar Redlin, Saleem WatsonPublisher:Cengage Learning
 College AlgebraAlgebraISBN:9781305115545Author:James Stewart, Lothar Redlin, Saleem WatsonPublisher:Cengage Learning
 Algebra & Trigonometry with Analytic GeometryAlgebraISBN:9781133382119Author:SwokowskiPublisher:Cengage
 Trigonometry (MindTap Course List)TrigonometryISBN:9781337278461Author:Ron LarsonPublisher:Cengage Learning
 Glencoe Algebra 1, Student Edition, 9780079039897...AlgebraISBN:9780079039897Author:CarterPublisher:McGraw Hill
Algebra and Trigonometry (MindTap Course List)
Algebra
ISBN:9781305071742
Author:James Stewart, Lothar Redlin, Saleem Watson
Publisher:Cengage Learning
College Algebra
Algebra
ISBN:9781305115545
Author:James Stewart, Lothar Redlin, Saleem Watson
Publisher:Cengage Learning
Algebra & Trigonometry with Analytic Geometry
Algebra
ISBN:9781133382119
Author:Swokowski
Publisher:Cengage
Trigonometry (MindTap Course List)
Trigonometry
ISBN:9781337278461
Author:Ron Larson
Publisher:Cengage Learning
Glencoe Algebra 1, Student Edition, 9780079039897...
Algebra
ISBN:9780079039897
Author:Carter
Publisher:McGraw Hill
What is a Linear Equation in One Variable?; Author: Don't Memorise;https://www.youtube.com/watch?v=lDOYdBgtnjY;License: Standard YouTube License, CC-BY
Linear Equation | Solving Linear Equations | What is Linear Equation in one variable ?; Author: Najam Academy;https://www.youtube.com/watch?v=tHm3X_Ta_iE;License: Standard YouTube License, CC-BY