
Concept explainers
Videos
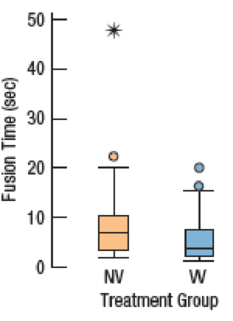
Stereograms Stereograms appear to be composed entirely of random dots. However, they contain separate images that a viewer can “fuse” into a three-dimensional (3D) image by staring at the dots while defocusing the eyes. An experiment was performed to determine whether knowledge of the embedded image affected the time required for subjects to fuse the images.
One group of subjects (group NV) received no information or just verbal information about the shape of the embedded object. A second group (group VV) received both verbal information and visual information (specifically, a drawing of the object). The experimenters measured how many seconds it took for the subject to report that he or she saw the 3D image.
- a) What two variables are discussed in this description?
- b) For each variable, is it quantitative or categorical? If quantitative, what are the units?
- c) The boxplots compare the fusion times for the two treatment groups. Write a few sentences comparing these distributions. What does the experiment show?
Want to see the full answer?
Check out a sample textbook solution
Chapter 4 Solutions
Intro Stats + New Mylab Statistics With Pearson Etext:
Additional Math Textbook Solutions
Elementary Statistics Using The Ti-83/84 Plus Calculator, Books A La Carte Edition (5th Edition)
Statistical Reasoning for Everyday Life (5th Edition)
Elementary Statistics: Picturing the World (7th Edition)
Basic Business Statistics, Student Value Edition (13th Edition)
Introductory Statistics
The Practice of Statistics for AP - 4th Edition


 Functions and Change: A Modeling Approach to Coll...AlgebraISBN:9781337111348Author:Bruce Crauder, Benny Evans, Alan NoellPublisher:Cengage Learning
 Algebra & Trigonometry with Analytic GeometryAlgebraISBN:9781133382119Author:SwokowskiPublisher:Cengage