
Trigonometry
11th Edition
ISBN: 9780134217642
Author: Lial, Margaret L.
Publisher: PEARSON
expand_more
expand_more
format_list_bulleted
Concept explainers
Videos
Question
Chapter 4, Problem 50RE
(a)
To determine
To calculate: The time between high tides in given graph.
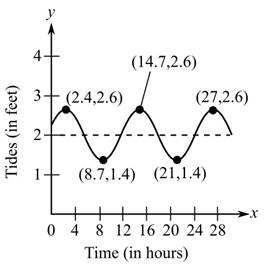
(b)
To determine
To calculate: The difference in water levels between high tide and low tide.
(c)
To determine
To calculate: The estimation of the tides for
Expert Solution & Answer
Want to see the full answer?
Check out a sample textbook solution
Chapter 4 Solutions
Trigonometry
Ch. 4.1 - CONCEPT PREVIEW Fill in the blank(s) to correctly...Ch. 4.1 -
CONCEPT PREVIEW Fill in the blank(s) to correctly...Ch. 4.1 - CONCEPT PREVIEW Fill in the blank(s) to correctly...Ch. 4.1 - CONCEPT PREVIEW Fill in the blank(s) to correctly...Ch. 4.1 -
5. The least positive number x for which cos x =...Ch. 4.1 - CONCEPT PREVIEW Fill in the blank(s) to correctly...Ch. 4.1 - Concept Check Match each function with its graph...Ch. 4.1 - Concept Check Match each function with its graph...Ch. 4.1 -
Concept Check Match each function with its graph...Ch. 4.1 - Concept Check Match each function with its graph...
Ch. 4.1 - Concept Check Match each function with its graph...Ch. 4.1 - Concept Check Match each function with its graph...Ch. 4.1 -
Graph each function over the interval [ –2π, 2π]....Ch. 4.1 - Graph each function over the interval [ 2, 2]....Ch. 4.1 - Graph each function over the interval [2, 2]. Give...Ch. 4.1 -
Graph each function over the interval [–2π, 2π]....Ch. 4.1 - Graph each function over the interval [2,2]. Give...Ch. 4.1 -
Graph each function over the interval [–2π,2π]....Ch. 4.1 -
Graph each function over the interval [–2 π,2π]....Ch. 4.1 - Graph each function over the interval [–2π,2π]....Ch. 4.1 - Graph each function over the interval [2,2 ]. Give...Ch. 4.1 - Prob. 22ECh. 4.1 - Graph each function over a two-period interval....Ch. 4.1 -
Graph each function over a two-period interval....Ch. 4.1 -
Graph each function over a two-period interval....Ch. 4.1 - Graph each function over a two-period interval....Ch. 4.1 - Graph each function over a two-period interval....Ch. 4.1 - Graph each function over a two-period interval....Ch. 4.1 - Graph each function over a two-period interval....Ch. 4.1 -
Graph each function over a two-period interval....Ch. 4.1 - Graph each function over a two-period interval....Ch. 4.1 -
Graph each function over a two-period interval....Ch. 4.1 - Graph each function over a two-period interval....Ch. 4.1 -
Graph each function over a two-period interval....Ch. 4.1 -
Graph each function over a two-period interval....Ch. 4.1 -
Graph each function over a two-period interval....Ch. 4.1 -
Graph each function over a two-period interval....Ch. 4.1 -
Graph each function over a two-period interval....Ch. 4.1 - Graph each function over a two-period interval....Ch. 4.1 - Graph each function over a two-period interval....Ch. 4.1 - Connecting Graphs with Equations Determine an...Ch. 4.1 - Connecting Graphs with Equations Determine an...Ch. 4.1 - Connecting Graphs with Equations Determine an...Ch. 4.1 - Connecting Graphs with Equations Determine an...Ch. 4.1 - Connecting Graphs with Equations Determine an...Ch. 4.1 - Connecting Graphs with Equations Determine an...Ch. 4.1 - Average Annual Temperature Scientists believe that...Ch. 4.1 - Blood Pressure Variation The graph gives the...Ch. 4.1 - Prob. 49ECh. 4.1 - Prob. 50ECh. 4.1 - Prob. 51ECh. 4.1 - Prob. 52ECh. 4.1 - Prob. 53ECh. 4.1 - Activity of a Nocturnal Animal Many activities of...Ch. 4.1 -
55. Atmospheric Carbon Dioxide At Mauna Loa....Ch. 4.1 - Atmospheric Carbon Dioxide Refer to Exercise 55....Ch. 4.1 -
57. Average Daily Temperature The temperature in...Ch. 4.1 - 58. Fluctuation in the Solar Constant The solar...Ch. 4.1 -
Musical Sound Waves Pure sounds produce single...Ch. 4.1 - Musical Sound Waves Pure sounds produce single...Ch. 4.1 - Prob. 61ECh. 4.1 - Prob. 62ECh. 4.1 - Prob. 63ECh. 4.1 - Prob. 64ECh. 4.1 - Prob. 65ECh. 4.1 - Prob. 66ECh. 4.2 - CONCEPT PREVIEW Fill in the blank(s) to correctly...Ch. 4.2 - CONCEPT PREVIEW Fill in the blank(s) to correctly...Ch. 4.2 - CONCEPT PREVIEW Fill in the blanks to correctly...Ch. 4.2 - CONCEPT PREVIEW Fill in the blanks to correctly...Ch. 4.2 -
CONCEPT PREVIEW Fill in the blank(s) to correctly...Ch. 4.2 - CONCEPT PREVIEW Fill in the blank(s) to correctly...Ch. 4.2 -
CONCEPT PREVIEW Fill in the blank(s) to correctly...Ch. 4.2 - CONCEPT PREVIEW Fill in the blanks to correctly...Ch. 4.2 - Concept Check Match each function with its graph...Ch. 4.2 - Concept Check Match each function with its graph...Ch. 4.2 - Concept Check Match each function w ith its graph...Ch. 4.2 - Concept Check Match each function w ith its graph...Ch. 4.2 - Concept Check Match each function with its graph...Ch. 4.2 - Concept Check Match each function with its graph...Ch. 4.2 - Concept Check Match each function with its graph...Ch. 4.2 - Concept Check Match each function with its graph...Ch. 4.2 - The graphs of y = sin x + 1 and y = sin(x + 1) are...Ch. 4.2 - Concept Check Refer to Exercise 17. Which one of...Ch. 4.2 -
Concept Check Match each function in Column I...Ch. 4.2 - Concept Check Match each function in Column I with...Ch. 4.2 -
Concept Check Match each function in Column I...Ch. 4.2 - Concept Check Match each function in Column I with...Ch. 4.2 - Concept Check Fill in each blank with the word...Ch. 4.2 - Prob. 24ECh. 4.2 - Connecting Graphs with equations Each function...Ch. 4.2 - Connecting Graphs with Equations Each function...Ch. 4.2 -
Connecting Graphs with Equations Each function...Ch. 4.2 - Prob. 28ECh. 4.2 -
Find the amplitude, the period, any vertical...Ch. 4.2 -
Find the amplitude, the period, any vertical...Ch. 4.2 -
Find the amplitude, the period, any vertical...Ch. 4.2 -
Find the amplitude, the period, any vertical...Ch. 4.2 - Find the amplitude, the period, any vertical...Ch. 4.2 -
Find the amplitude, the period, any vertical...Ch. 4.2 - Find the amplitude, the period, any vertical...Ch. 4.2 - Find the amplitude, the period, any vertical...Ch. 4.2 - Graph each function over a two-period interval....Ch. 4.2 - Graph each function over a two-period interval....Ch. 4.2 - Graph each function over a two-period interval....Ch. 4.2 - Graph each function over a two-period interval....Ch. 4.2 -
Graph each function over a two-period interval....Ch. 4.2 - Graph each function over a two-period interval....Ch. 4.2 -
Graph each function over a one-period interval....Ch. 4.2 -
Graph each function over a one-period interval....Ch. 4.2 - Graph each function over a one-period interval....Ch. 4.2 - Graph each function over a one-period interval....Ch. 4.2 - Graph each function over a one-period interval....Ch. 4.2 -
Graph each function over a one-period interval....Ch. 4.2 - Graph each function over a two-period interval....Ch. 4.2 - Graph each function over a two-period interval....Ch. 4.2 -
Graph each function over a two-period interval....Ch. 4.2 -
Graph each function over a two-period interval....Ch. 4.2 - Graph each function over a two-period interval....Ch. 4.2 -
Graph each function over a two-period interval....Ch. 4.2 -
Graph each function over a two-period interval....Ch. 4.2 - Graph each function over a two-period interval....Ch. 4.2 -
Graph each function over a two-period interval....Ch. 4.2 - Graph each function over a one-period interval....Ch. 4.2 -
Graph each function over a one-period interval....Ch. 4.2 - Prob. 60ECh. 4.2 - Average Monthly Temperature The average monthly...Ch. 4.2 - Prob. 62ECh. 4.2 - Prob. 63ECh. 4.2 - Prob. 64ECh. 4.2 - Prob. 65ECh. 4.2 - Prob. 66ECh. 4.2 - Prob. 1QCh. 4.2 - Graph each function over a two-period interval....Ch. 4.2 - Prob. 3QCh. 4.2 - Prob. 4QCh. 4.2 - Prob. 5QCh. 4.2 - Graph each function over a two-period interval....Ch. 4.2 - Prob. 7QCh. 4.2 - Prob. 8QCh. 4.2 - Prob. 9QCh. 4.2 - Prob. 10QCh. 4.2 - Prob. 11QCh. 4.2 - Prob. 12QCh. 4.3 - 1. The least positive value x for which tan x = 0...Ch. 4.3 - The least positive value x for which cot x = 0 is...Ch. 4.3 - Concept Check Fill in each blank with the word...Ch. 4.3 - Concept Check Fill in each blank with the word...Ch. 4.3 - The negative value k with the greatest value for...Ch. 4.3 - CONCEPT PREVIEW Fill in the blank(s) to correctly...Ch. 4.3 - Concept Check Match each function with its graph...Ch. 4.3 - Concept Check Match each function with its graph...Ch. 4.3 -
Concept Check Match each function with its...Ch. 4.3 - Concept Check Match each function with its graph...Ch. 4.3 - Concept CheckMatch each function with its graph...Ch. 4.3 - Concept Check Match each function with its graph...Ch. 4.3 - Graph each function over a one-period interval....Ch. 4.3 -
Graph each function over a one-period interval....Ch. 4.3 - Graph each function over a one-period interval....Ch. 4.3 - Graph each function over a one-period interval....Ch. 4.3 - Graph each function over a one-period interval....Ch. 4.3 - Graph each function over a one-period interval....Ch. 4.3 - Graph each function over a one-period interval....Ch. 4.3 - Graph each function over a one-period interval....Ch. 4.3 -
Graph each function over a one-period...Ch. 4.3 - Graph each function over a one-period interval....Ch. 4.3 - Graph each function over a one-period interval....Ch. 4.3 -
Graph each function over a one-period interval....Ch. 4.3 - Graph each function over a two-period interval....Ch. 4.3 -
Graph each function over a two-period interval....Ch. 4.3 -
Graph each function over a two-period...Ch. 4.3 -
Graph each function over a two-period...Ch. 4.3 - Graph each function over a two-period interval....Ch. 4.3 - Graph each function over a two-period interval....Ch. 4.3 - Prob. 31ECh. 4.3 - Graph each function over a two-period interval....Ch. 4.3 - Graph each function over a two-period interval....Ch. 4.3 - Prob. 34ECh. 4.3 - Graph each function over a two-period interval....Ch. 4.3 - Prob. 36ECh. 4.3 - Graph each function over a two-period interval....Ch. 4.3 - Prob. 38ECh. 4.3 - Prob. 39ECh. 4.3 - Prob. 40ECh. 4.3 - Prob. 41ECh. 4.3 - Prob. 42ECh. 4.3 - Prob. 43ECh. 4.3 - Prob. 44ECh. 4.3 - Concept Check Decide whether each statement is...Ch. 4.3 - Concept CheckDecide whether each statement is true...Ch. 4.3 -
Concept Check Decide whether each statement is...Ch. 4.3 - Prob. 48ECh. 4.3 - Concept Check If c is any number, then how many...Ch. 4.3 - Prob. 50ECh. 4.3 - 51. Show that tan(–x) = –tan x by writing tan(–x)...Ch. 4.3 - 52. Show that cot (–x) = –cot x by writing cot...Ch. 4.3 - Prob. 53ECh. 4.3 - Prob. 54ECh. 4.3 - Prob. 55ECh. 4.3 - Prob. 56ECh. 4.3 - Prob. 57ECh. 4.3 - Prob. 58ECh. 4.3 - Prob. 59ECh. 4.3 - Prob. 60ECh. 4.3 - Prob. 61ECh. 4.3 - Prob. 62ECh. 4.4 - CONCEPT PREVIEW Match each description in Column I...Ch. 4.4 -
CONCEPT PREVIEW Match each description in...Ch. 4.4 -
CONCEPT PREVIEW Match each description in Column...Ch. 4.4 -
CONCEPT PREVIEW Match each description in Column...Ch. 4.4 -
CONCEPT PREVIEW Match each description in Column...Ch. 4.4 -
CONCEPT PREVIEW Match each description in Column...Ch. 4.4 - Concept Check Match each function with its graph...Ch. 4.4 - Concept Check Match each function with its graph...Ch. 4.4 - Concept Check Match each function with its graph...Ch. 4.4 - Concept Check Match each function with its graph...Ch. 4.4 - Graph each function over a one-period interval....Ch. 4.4 - Graph each function over a one-period interval....Ch. 4.4 - Graph each function over a one-period interval....Ch. 4.4 - Graph each function over a one-period interval....Ch. 4.4 -
Graph each function over a one-period interval....Ch. 4.4 - Graph each function over a one-period interval....Ch. 4.4 - Graph each function over a one-period interval....Ch. 4.4 - Graph each function over a one-period interval....Ch. 4.4 - Graph each function over a one-period interval....Ch. 4.4 - Graph each function over a one-period interval....Ch. 4.4 - Graph each function over a one-period interval....Ch. 4.4 - Graph each function over a one-period interval....Ch. 4.4 - Graph each function over a one-period interval....Ch. 4.4 - Graph each function over a one-period interval....Ch. 4.4 - Connecting Graphs with EquationsDetermine an...Ch. 4.4 - Connecting Graphs with Equations Determine an...Ch. 4.4 - Connecting Graphs with Equations Determine an...Ch. 4.4 - Connecting Graphs with Equations Determine an...Ch. 4.4 - Connecting Graphs with Equations Determine an...Ch. 4.4 - Prob. 30ECh. 4.4 - Concept CheckDecide whether each statement is true...Ch. 4.4 - Concept Check Decide whether each statement is...Ch. 4.4 - Concept CheckDecide whether each statement is true...Ch. 4.4 - Prob. 34ECh. 4.4 - 35. Concept Check If c is any number such that -1...Ch. 4.4 - Prob. 36ECh. 4.4 - 37. Show that sec (–x) = sec x by writing sec (–x)...Ch. 4.4 - Prob. 38ECh. 4.4 - Prob. 39ECh. 4.4 - (Modeling) Distance of a Rotating Beacon The...Ch. 4.4 - Prob. 41ECh. 4.4 - Prob. 42ECh. 4.4 - Prob. 43ECh. 4.4 - Prob. 44ECh. 4.4 - Prob. 45ECh. 4.4 - Prob. 46ECh. 4.4 - Prob. 1SECh. 4.4 - Prob. 2SECh. 4.4 - These summary exercises provide practice with the...Ch. 4.4 - Prob. 4SECh. 4.4 - Prob. 5SECh. 4.4 - Prob. 6SECh. 4.4 - Prob. 7SECh. 4.4 -
Graph each function over a two-period...Ch. 4.4 - Prob. 9SECh. 4.4 - Graph each function over a two-period...Ch. 4.5 - CONCEPT PREVIEW Refer to the equations in the...Ch. 4.5 - Prob. 2ECh. 4.5 - CONCEPT PREVIEW Refer to the equations in the...Ch. 4.5 - Prob. 4ECh. 4.5 - Prob. 5ECh. 4.5 - Prob. 6ECh. 4.5 - Spring Motion An object is attached to a coiled...Ch. 4.5 - Spring Motion Repeat Exercise 7, but assume that...Ch. 4.5 - 9. Voltage of an Electrical Circuit The voltage E...Ch. 4.5 - Prob. 10ECh. 4.5 - Particle Movement Write the equation and then...Ch. 4.5 - Prob. 12ECh. 4.5 -
13. Pendulum Motion What are the period P and...Ch. 4.5 - Prob. 14ECh. 4.5 - Spring Motion The formula for the up and down...Ch. 4.5 - Spring Motion (See Exercise 15.) A spring with...Ch. 4.5 - Spring Motion The position of a weight attached to...Ch. 4.5 - Spring Motion The position of a weight attached to...Ch. 4.5 - Spring Motion A weight attached to a spring is...Ch. 4.5 -
20. Spring Motion A weight attached to a spring...Ch. 4.5 -
(Modeling) Springs A weight on a spring has...Ch. 4.5 - Prob. 22ECh. 4.5 -
(Modeling) Springs A weight on a spring has...Ch. 4.5 -
(Modeling) Springs A weight on a spring has...Ch. 4.5 - Prob. 25ECh. 4.5 - Prob. 26ECh. 4.5 - Prob. 27ECh. 4.5 - Prob. 28ECh. 4.5 -
(Modeling) Spring Motion Consider the spring in...Ch. 4.5 - Prob. 30ECh. 4.5 - Prob. 31ECh. 4.5 - (Modeling) Spring Motion Consider the spring in...Ch. 4.5 - Prob. 33ECh. 4.5 - Prob. 34ECh. 4 - Concept Check Which one of the following...Ch. 4 - Prob. 2RECh. 4 - Prob. 3RECh. 4 - Prob. 4RECh. 4 - Prob. 5RECh. 4 - Prob. 6RECh. 4 - Prob. 7RECh. 4 - Prob. 8RECh. 4 -
For each function, give the amplitude, period,...Ch. 4 - Prob. 10RECh. 4 - Prob. 11RECh. 4 - Prob. 12RECh. 4 - Prob. 13RECh. 4 -
For each function, give the amplitude, period,...Ch. 4 - Prob. 15RECh. 4 - Prob. 16RECh. 4 - Prob. 17RECh. 4 - Prob. 18RECh. 4 - Prob. 19RECh. 4 - Prob. 20RECh. 4 - Prob. 21RECh. 4 - Prob. 22RECh. 4 - Prob. 23RECh. 4 - Prob. 24RECh. 4 - Prob. 25RECh. 4 - Prob. 26RECh. 4 - Prob. 27RECh. 4 - Prob. 28RECh. 4 - Prob. 29RECh. 4 - Prob. 30RECh. 4 - Prob. 31RECh. 4 - Prob. 32RECh. 4 - Graph each function over a one-period...Ch. 4 -
Graph each function over a one-period...Ch. 4 -
Graph each function over a one-period...Ch. 4 - Prob. 36RECh. 4 -
Graph each function over a one-period...Ch. 4 - Prob. 38RECh. 4 - Prob. 39RECh. 4 - Prob. 40RECh. 4 - Prob. 41RECh. 4 - Prob. 42RECh. 4 - (Modeling) Monthly Temperatures A set of...Ch. 4 - Prob. 44RECh. 4 - Prob. 45RECh. 4 - Prob. 46RECh. 4 - Prob. 47RECh. 4 - Prob. 48RECh. 4 - Prob. 49RECh. 4 - Prob. 50RECh. 4 - Prob. 51RECh. 4 - Prob. 52RECh. 4 - Prob. 53RECh. 4 - Prob. 54RECh. 4 - Prob. 55RECh. 4 - Prob. 56RECh. 4 - Prob. 57RECh. 4 - Prob. 58RECh. 4 - Prob. 1TCh. 4 - Prob. 2TCh. 4 - Prob. 3TCh. 4 - Prob. 4TCh. 4 - Prob. 5TCh. 4 - Prob. 6TCh. 4 - Prob. 7TCh. 4 - Prob. 8TCh. 4 - Prob. 9TCh. 4 - Prob. 10TCh. 4 - Prob. 11TCh. 4 - Prob. 12TCh. 4 - Average Monthly Temperature The average monthly...Ch. 4 -
14. Spring Motion The position of a weight...Ch. 4 - Prob. 15T
Knowledge Booster


Learn more about
Need a deep-dive on the concept behind this application? Look no further. Learn more about this topic, trigonometry and related others by exploring similar questions and additional content below.Similar questions
- Finding pH the hydrogen ion concentrations in cheese range from 4.0x10⁻⁷ M tp 1.6x10⁻⁵M. Find The corresponding range of pH readings.arrow_forwardRadioactive Decay The half-life of radium-226 is 1590 years. a If a sample has a mass of 150 mg, find a function that models the mass that remains after t years. b Find the mass that will remain after 1000 years. c After how many years will only 50 mg remain?arrow_forwardHOW DO YOU SEE IT? The figure shows the graphs of y=lnx,y=lnx2,y=ln2x, and y=ln2. Match each function with its graph. (The graphs are labeled A through D .) Explain.arrow_forward
- Average Speed: A commuter regularly drives 70 miles from home to work, and the amount of time required for the trip varies widely as a result of road and traffic conditions. The average speed for such a trip is a function of the time required. For example, if the trip takes 2 hours, then the average speed is 70/2 = 35 miles per hour. a. What is the average speed if the trip takes an hour and a half? b. Find a formula for the average speed as a function of the time required for the trip. You need to choose variable and function names. Be sure to state units. c. Make a graph of the average speed as a function of the time required. Includes trips from 1 hour to 3 hours in length. d. Is the graph concave up or concave down? Explain in practical terms what this meansarrow_forwardNumerical Analysis (a) Complete the table for the function fx=lnx/x. (b) Use the table in part (a) to determine what value fx approaches as x increases without bound. (c) Use a graphing utility to confirm the result of part (b).arrow_forwardBird Population The graph shows the population of a rare species of bird, where t represents years since 2009 and n(t) is measured in thousands. a Find a function that models the bird population at time t in the form n(t)=n0ert. b What is the bird population expected to be in the year 2020?arrow_forward
- Population Growth The projected population of the United States for the years 2025 through 2055 can be modeled by P=307.58e0.0052t, where P is the population (in millions) and t is the time (in years), with t=25 corresponding to 2025. (a) Use a graphing utility to graph the function for the years 2025 through 2055. (b) Use the table feature of the graphing utility to create a table of values for the same time period as in part (a). (c) According to the model, during what year will the population of the United States exceed 430 million?arrow_forwardPlanet Growth The amount of growth of plants in an ungrazed pasture is a function of the amount of plant biomass already present and the amount of rainfall. For a pasture in the arid zone of Australia the formula Y=55.120.01535N0.00056N2+3.946R gives an approximation of the growth. Here R is the amount of rainfall, in millimeters, over a 3 month period; N is the plant biomass, in kilograms per hectare, at the beginning of that period; and Y is the growth, in kilograms per hectare, of the biomass over that period. For comparison, 100 millimeters is about 3.9 inches, and 100 kilograms per hectare is about 89 pounds per acre. For this exercise, assume that the amount of plant biomass initially present is 400 kilograms per hectare, so N=400. a. Find a formula for the growth Y as a function of the amount R of rainfall. b. Make a graph of Y versus r. Include values of R from 40 to 160 millimeters. c. What happens to Y as R increases? Explain your answer in practical terms. d. How much growth will there be over a 3 month period if initially there are 400 kilograms per hectare of plant biomass and the amount of rainfall is 100 millimeters?arrow_forwardSpawner-Recruit Model In fish management it is important to know the relationship between the abundance of the spawners also called the parent stock and the abundance of the recruitsthat is, those hatchlings surviving to maturity. According to the Ricker model, the number of recruits R as a function of the number of spawners P has the form R=APeBp for some positive constants A and B. This model describes well a phenomenon observed in some fisheries: A large spawning group can actually lead to a small group of recruits. In a study of the sockeye salmon, it was determined that A=4 and B=0.7. Here we measure P and R in thousands of salmon. a. Make a graph of R versus P for the sockeye salmon. Assume there are at most 3000 spawners. b. Find the maximum number of salmon recruits possible. c. If the number of recruits R is greater than the number of spawners P, then the difference R-P of the recruits can be removed by fishing, and next season there will once again be P spawners surviving to renew the cycle. What value of P gives the maximum value of R-P, the number of fish available for removal by fishing?arrow_forward
arrow_back_ios
arrow_forward_ios
Recommended textbooks for you
 Algebra and Trigonometry (MindTap Course List)AlgebraISBN:9781305071742Author:James Stewart, Lothar Redlin, Saleem WatsonPublisher:Cengage Learning
 Algebra & Trigonometry with Analytic GeometryAlgebraISBN:9781133382119Author:SwokowskiPublisher:Cengage
 College AlgebraAlgebraISBN:9781305115545Author:James Stewart, Lothar Redlin, Saleem WatsonPublisher:Cengage Learning
 Trigonometry (MindTap Course List)TrigonometryISBN:9781337278461Author:Ron LarsonPublisher:Cengage Learning
 Functions and Change: A Modeling Approach to Coll...AlgebraISBN:9781337111348Author:Bruce Crauder, Benny Evans, Alan NoellPublisher:Cengage Learning
Algebra and Trigonometry (MindTap Course List)
Algebra
ISBN:9781305071742
Author:James Stewart, Lothar Redlin, Saleem Watson
Publisher:Cengage Learning
Algebra & Trigonometry with Analytic Geometry
Algebra
ISBN:9781133382119
Author:Swokowski
Publisher:Cengage
College Algebra
Algebra
ISBN:9781305115545
Author:James Stewart, Lothar Redlin, Saleem Watson
Publisher:Cengage Learning
Trigonometry (MindTap Course List)
Trigonometry
ISBN:9781337278461
Author:Ron Larson
Publisher:Cengage Learning
Functions and Change: A Modeling Approach to Coll...
Algebra
ISBN:9781337111348
Author:Bruce Crauder, Benny Evans, Alan Noell
Publisher:Cengage Learning
01 - What Is A Differential Equation in Calculus? Learn to Solve Ordinary Differential Equations.; Author: Math and Science;https://www.youtube.com/watch?v=K80YEHQpx9g;License: Standard YouTube License, CC-BY
Higher Order Differential Equation with constant coefficient (GATE) (Part 1) l GATE 2018; Author: GATE Lectures by Dishank;https://www.youtube.com/watch?v=ODxP7BbqAjA;License: Standard YouTube License, CC-BY
Solution of Differential Equations and Initial Value Problems; Author: Jefril Amboy;https://www.youtube.com/watch?v=Q68sk7XS-dc;License: Standard YouTube License, CC-BY