Introduction to Statistics and Data Analysis
5th Edition
ISBN: 9781305115347
Author: Roxy Peck; Chris Olsen; Jay L. Devore
Publisher: Brooks Cole
bartleby

Videos

Question
Book Icon
Chapter 4, Problem 55CR

a.

To determine

Compute the values of the mean acrylamide level and the seven deviations from the mean.

a.

Expert Solution
Check Mark

Answer to Problem 55CR

  • The mean acrylamide level is 287.714.
  • The seven deviations from the mean are 209.286, –94.714, 40.286, –132.714, 38.286, –42.714, and –17.714.

Explanation of Solution

Calculation:

The data represent the acrylamide content of French fries purchased at seven different locations.

Mean:

Mean is defined as the sum of observed values divided by the number of observations.

Mean, variance, and standard deviation:

Software procedure:

Step-by-step procedure to find the mean, variance, and standard deviation using the MINITAB software:

  • Choose Stat > Basic Statistics > Display Descriptive Statistics.
  • In Variables, enter the columns Content.
  • Choose option Statistics, and select Mean, Variance andStandard deviation.
  • Click OK.

The output obtained using the MINITAB software is given below:

Introduction to Statistics and Data Analysis, Chapter 4, Problem 55CR

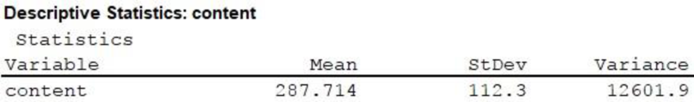
  • Thus, the mean acrylamide content is 287.714.
  • Here, the deviations from the mean are obtained by subtracting the mean value from each observation.
  • The seven deviations from the mean are obtained as given below:
ObservationsDeviation=ObservationMean
497209.286(=497287.714)
19394.714(=193287.714)
32840.286(=328287.714)
155132.714(=155287.714)
32638.286(=326287.714)
24542.714(=245287.714)
27017.714(=270287.714)
  • Therefore, the five deviations from the mean are 209.286, –94.714, 40.286, –132.714, 38.286, ­42.714, and –17.714.

b.

To determine

Verify that the sum of deviations from the mean is equal to 0, except for the effect of rounding.

b.

Expert Solution
Check Mark

Explanation of Solution

Properties of mean:

  • It will be affected by the extreme values.
  • The sum of the deviations of each value from the mean is zero.
  • Every set of the interval and the ratio level data have mean.

Based on the concept of measure of center, the sum of the deviation from the mean will always be equal to zero.

In this context, the sum of the deviation is obtained as follows:

Deviation=(Observationmean)=[209.286+(94.714)+40.286+(132.714)+(38.286)+(42.714)+(17.714)]=0.002

Here, it can be observed that the sum of the deviations from the mean is approximately equal to zero, since the sample mean and deviations are rounded.

Thus, except for the effect of rounding, the sum of deviations from the mean is equal to zero.

c.

To determine

Calculate the variance and standard deviation of the acrylamide content.

c.

Expert Solution
Check Mark

Answer to Problem 55CR

The variance of the acrylamide content is 12,601.9.

The standard deviation of the acrylamide content is 112.3.

Explanation of Solution

From Part (a), the variance and standard deviation of the acrylamide content are 12,601.9 and 112.3, respectively.

Hence, the variance of the acrylamide content is 12,601.9 units and the standard deviation of the acrylamide content is 112.3 units.

Want to see more full solutions like this?

Subscribe now to access step-by-step solutions to millions of textbook problems written by subject matter experts!

Chapter 4 Solutions

Introduction to Statistics and Data Analysis

Ch. 4.1 - Houses in California are expensive, especially on...Ch. 4.1 - Consider the following statement: More than 65% of...Ch. 4.1 - A sample consisting of four pieces of luggage was...Ch. 4.1 - Suppose that 10 patients with meningitis received...Ch. 4.1 - A study of the lifetime (in hours) for a certain...Ch. 4.1 - An instructor has graded 19 exam papers submitted...Ch. 4.2 - The following data are costs (in cents) per ounce...Ch. 4.2 - Cost per serving (in cents) for six high-fiber...Ch. 4.2 - Combining the cost-per-serving data for high-fiber...Ch. 4.2 - Prob. 20ECh. 4.2 - The accompanying data are consistent with summary...Ch. 4.2 - The paper referenced in the previous exercise also...Ch. 4.2 - Prob. 23ECh. 4.2 - Prob. 24ECh. 4.2 - The accompanying data on number of minutes used...Ch. 4.2 - Give two sets of five numbers that have the same...Ch. 4.2 - Prob. 27ECh. 4.2 - The U.S. Department of Transportation reported the...Ch. 4.2 - The Ministry of Health and Long-Term Care in...Ch. 4.2 - In 1997, a woman sued a computer keyboard...Ch. 4.2 - The standard deviation alone does not measure...Ch. 4.3 - Based on a large national sample of working...Ch. 4.3 - Prob. 33ECh. 4.3 - Prob. 34ECh. 4.3 - Prob. 35ECh. 4.3 - Fiber content (in grams per serving) and sugar...Ch. 4.3 - Shown here are the number of auto accidents per...Ch. 4.4 - The average playing time of music albums in a...Ch. 4.4 - In a study investigating the effect of car speed...Ch. 4.4 - Prob. 40ECh. 4.4 - Mobile homes are tightly constructed for energy...Ch. 4.4 - Prob. 42ECh. 4.4 - A student took two national aptitude tests. The...Ch. 4.4 - Suppose that your younger sister is applying for...Ch. 4.4 - The report Who Borrows Most? Bachelors Degree...Ch. 4.4 - Prob. 46ECh. 4.4 - Prob. 47ECh. 4.4 - Suppose that your statistics professor returned...Ch. 4.4 - Prob. 49ECh. 4.4 - Suppose that the average reading speed of students...Ch. 4.4 - Prob. 51ECh. 4.4 - The accompanying table gives the mean and standard...Ch. 4.5 - The authors of the paper Delayed Time to...Ch. 4.5 - The paper Portable Social Groups: Willingness to...Ch. 4 - Prob. 55CRCh. 4 - Prob. 56CRCh. 4 - Prob. 57CRCh. 4 - Prob. 58CRCh. 4 - Because some homes have selling prices that are...Ch. 4 - Although bats are not known for their eyesight,...Ch. 4 - Prob. 61CRCh. 4 - Prob. 62CRCh. 4 - Prob. 63CRCh. 4 - Prob. 64CRCh. 4 - Prob. 65CRCh. 4 - Prob. 66CRCh. 4 - Prob. 67CRCh. 4 - Prob. 68CRCh. 4 - Prob. 69CRCh. 4 - Prob. 70CRCh. 4 - Prob. 71CRCh. 4 - Age at diagnosis for each of 20 patients under...Ch. 4 - Suppose that the distribution of scores on an exam...
Knowledge Booster
Background pattern image
Statistics
Learn more about
Need a deep-dive on the concept behind this application? Look no further. Learn more about this topic, statistics and related others by exploring similar questions and additional content below.
Recommended textbooks for you
Text book image
Glencoe Algebra 1, Student Edition, 9780079039897...
Algebra
ISBN:9780079039897
Author:Carter
Publisher:McGraw Hill
Hypothesis Testing using Confidence Interval Approach; Author: BUM2413 Applied Statistics UMP;https://www.youtube.com/watch?v=Hq1l3e9pLyY;License: Standard YouTube License, CC-BY
Hypothesis Testing - Difference of Two Means - Student's -Distribution & Normal Distribution; Author: The Organic Chemistry Tutor;https://www.youtube.com/watch?v=UcZwyzwWU7o;License: Standard Youtube License