Concept explainers
Videos
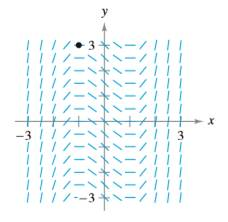
Slope Field In Exercises 45 and 46, a differential equation, a point, and a slope field are given. A slope field (or direction field) consists of line segments with slopes given by the differential equation. These line segments give a visual perspective of the slopes of the solutions of the differential equation, (a) Sketch two approximate solutions of the differential equation on the slope field, one of which passes through the indicated point. (To print an enlarged copy of the graph, go to MathGraphs.com.) (b) Use

Trending nowThis is a popular solution!

Chapter 4 Solutions
Calculus (MindTap Course List)
Additional Math Textbook Solutions
Precalculus: Mathematics for Calculus - 6th Edition
Calculus Early Transcendentals, Binder Ready Version
Finite Mathematics and Calculus with Applications (10th Edition)
Precalculus (6th Edition)
Calculus: Early Transcendentals (2nd Edition)
Calculus & Its Applications (14th Edition)


- Van der Waals Equation In Exercise 18 at the end of Section 2.3, we discussed the ideal gas law, which shows the relationship among volume V, pressure p, and temperature T for a fixed amount 1 mole of a gas. But chemists believe that in many situations, the van der Waals equation gives more accurate results. If we measure temperature T in kelvins, volume V in liters, and pressure p in atmosphere 1 atm is the pressure exerted by the atmosphere at sea level, then the relationship for carbon dioxide is given by p=0.082TV0.0433.592V2atm What volume does this equation predict for 1 mole of carbon dioxide at 500 kelvins and 100 atm?Suggestion: Consider volumes ranging from 0.1 to 1 liter.arrow_forwardPhysics Experiment Consider a physics laboratory experiment designed to determine an unknown mass. A flexible metal meter stick is clamped to a table with 50 centimeters overhanging the edge (see figure). Known masses Mranging from 200grams to 2000grams are attached to the end of the meter stick. For each mass, the meter stick is displaced vertically and then allowed to oscillate. The average time t(in seconds) of one oscillation for each mass is recorded in the table. A model for the data that can be used to predict the time of one oscillation is t=38M+16,96510(M+5000). (a) Use this model to create a table showing the predicted time for each of the masses shown in the table above. (b) Compare the predicted times with the experimental times. What can you conclude? (c) Use the model to approximate the mass of an object for which t=1.056seconds.arrow_forward
 Elementary Linear Algebra (MindTap Course List)AlgebraISBN:9781305658004Author:Ron LarsonPublisher:Cengage Learning
 Functions and Change: A Modeling Approach to Coll...AlgebraISBN:9781337111348Author:Bruce Crauder, Benny Evans, Alan NoellPublisher:Cengage Learning
 Algebra & Trigonometry with Analytic GeometryAlgebraISBN:9781133382119Author:SwokowskiPublisher:Cengage