Concept explainers
Videos
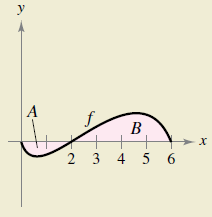
HOW DO YOU SEE IT? The graph of f is shown in the figure. The shaded region A has an area of 1.5, and
(a)
(b)
(c)
(d)
(e)
(f) The average value of f over the interval [0, 6] is
Want to see the full answer?
Check out a sample textbook solution
Chapter 4 Solutions
Calculus (MindTap Course List)


- HOW DO YOU SEE IT? Use the graph of the function to answer parts (a)-(e). (a) Find the domain and range of f. (b) Find the zero(s) of f. (c) Determine the open intervals on which f is increasing, decreasing, or constant. (d) Approximate any relative minimum or relative maximum values of f. (e) Is f even, odd, or neither?arrow_forwardFind the area of a triangle bounded by the x-axis,the line f(x)=1213x, and the line perpendicularto f(x) that passes through the origin.arrow_forwardGraphical Addition Two functions, f and g ,are given. Draw graphs of f , g , and f+g on the same graphing calculator screen to illustrate the concept of graphical addition. f(x)=x+2,g(x)=x2arrow_forward
 Big Ideas Math A Bridge To Success Algebra 1: Stu...AlgebraISBN:9781680331141Author:HOUGHTON MIFFLIN HARCOURTPublisher:Houghton Mifflin Harcourt
 Functions and Change: A Modeling Approach to Coll...AlgebraISBN:9781337111348Author:Bruce Crauder, Benny Evans, Alan NoellPublisher:Cengage Learning
 Trigonometry (MindTap Course List)TrigonometryISBN:9781337278461Author:Ron LarsonPublisher:Cengage Learning
 Algebra and Trigonometry (MindTap Course List)AlgebraISBN:9781305071742Author:James Stewart, Lothar Redlin, Saleem WatsonPublisher:Cengage Learning
 College AlgebraAlgebraISBN:9781305115545Author:James Stewart, Lothar Redlin, Saleem WatsonPublisher:Cengage Learning