
Videos
Use a calculator with an key to solve Exercises 71–76.
The bar graph shows the percentage of people 25 years of age and older who were college graduates in the United States for seven selected years.
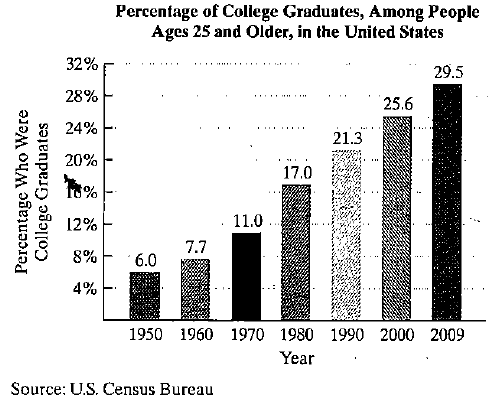
The functions
model the percentage of college graduates, among people ages 25 and older, f(x) or g(x), x years after 1950. Use these functions to solve Exercises 75–76.
Which function is a better model for the percentage who were college graduates in 1990?
Want to see the full answer?
Check out a sample textbook solution
Chapter 4 Solutions
COLLEGE ALGEBRA W/MYLABS PLUS >IC<


- Who is the inventor of the logistic function? 1.Ludwig Ogistic 2.The iranian physicist Piver Verfraco 3.The Belgian mathematician Pierre François Verhulst.arrow_forwardSuppose that a population of alligators has a constant death rate and birth rate proportional toP. If, initially there are 110 alligators, and alligators are dying at a rate of12 per year and being born at a rate of 11 per year initially: (a) What is the threshold population? (b) How long will it take until there are only 11 alligators left? Answer asaparrow_forwardThe population of the United States is predicted to be P(t) = 310e0.0073t million, where t is the number of years after the year 2010.† Predict the average population between the years 2010 and 2040.arrow_forward
 Algebra & Trigonometry with Analytic GeometryAlgebraISBN:9781133382119Author:SwokowskiPublisher:Cengage