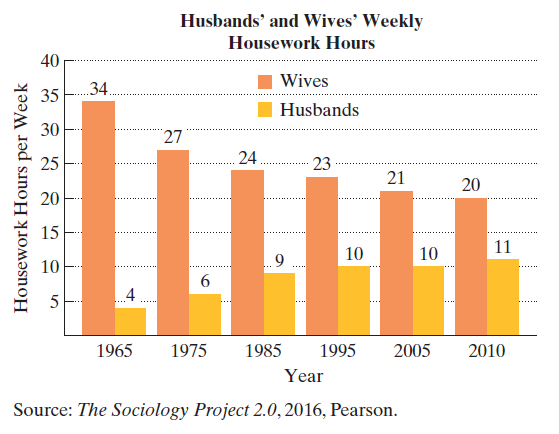
The bar graph shows the average number of hours per week that U.S. wives and husbands engaged in housework in six selected years. Use this information to solve Exercises 115-116. The function f ( x ) = 1.8 ln x + 3.42 models the husbands' weekly housework hours, f ( x ). x years after 1964. a. Use the function to find the number of weekly housework hours for husbands in 2010. Round to the nearest hour. Does this function value overestimate or underestimate the number of hours displayed by the graph? By how much? b. Use the function to project husbands' weekly housework hours in 2025. Round to the nearest hour.
The bar graph shows the average number of hours per week that U.S. wives and husbands engaged in housework in six selected years. Use this information to solve Exercises 115-116. The function f ( x ) = 1.8 ln x + 3.42 models the husbands' weekly housework hours, f ( x ). x years after 1964. a. Use the function to find the number of weekly housework hours for husbands in 2010. Round to the nearest hour. Does this function value overestimate or underestimate the number of hours displayed by the graph? By how much? b. Use the function to project husbands' weekly housework hours in 2025. Round to the nearest hour.
Solution Summary: The author explains that the function f(x) represents the husbands’ weekly housework hours, x years after 1964.
The bar graph shows the average number of hours per week that U.S. wives and husbands engaged in housework in six selected years. Use this information to solve Exercises 115-116.
The function
f
(
x
)
=
1.8
ln
x
+
3.42
models the husbands' weekly housework hours, f(x). x years after 1964.
a. Use the function to find the number of weekly housework hours for husbands in 2010. Round to the nearest hour. Does this function value overestimate or underestimate the number of hours displayed by the graph? By how much?
b. Use the function to project husbands' weekly housework hours in 2025. Round to the nearest hour.
Write an equation that defines the exponential functionwith base a> 0 ) What is the domain of this function?
Use the exponential growth model, A = A0ekt. In 1975, the population of Europe was 679 million. By 2015, the population had grown to 746 million.
Solve, a. Find an exponential growth function that models the data for 1975 through 2015.
b. By which year, to the nearest year, will the European population reach 800 million?
Determine whether the given below is (a) an exponential function, (b) an exponential equation, (c) an exponential inequality or (d) none of these.
0=-4x
Chapter 4 Solutions
MyLab Math with Pearson eText -- Standalone Access Card -- for Algebra and Trigonometry (6th Edition)
Need a deep-dive on the concept behind this application? Look no further. Learn more about this topic, algebra and related others by exploring similar questions and additional content below.


 Big Ideas Math A Bridge To Success Algebra 1: Stu...AlgebraISBN:9781680331141Author:HOUGHTON MIFFLIN HARCOURTPublisher:Houghton Mifflin Harcourt
 Glencoe Algebra 1, Student Edition, 9780079039897...AlgebraISBN:9780079039897Author:CarterPublisher:McGraw Hill
 Algebra & Trigonometry with Analytic GeometryAlgebraISBN:9781133382119Author:SwokowskiPublisher:Cengage