
Concept explainers
Videos
Reminder Round all answers to two decimal places unless otherwise indicated.
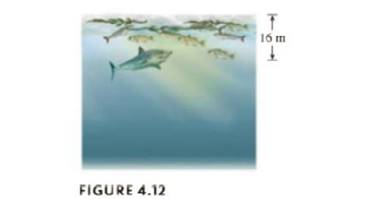
The Photic Zone This is a continuation of Exercise 18. In the ocean, the photic zone is the region where there is sufficient light for photosynthesis to occur. (See Figure 4.12.) For marine phytoplankton, the photic zone extends from the surface of the ocean to a depth where the light intensity is about

Trending nowThis is a popular solution!

Chapter 4 Solutions
Webassign Printed Access Card For Crauder/evans/noell's Functions And Change: A Modeling Approach To College Algebra, 6th Edition, Single-term


- Immigration The following graph shows immigrationin thousand to the United States has varied over the past century. Source: Homeland Security. a. Find the average annual rate of change in immigration for the first half of the century from 1905 to 1955. b. Find the average annual rate of change in immigration for the second half of the century from 1955 to 2005. c. Find the average annual rate of change in immigration for the entire century from 1905 to 2005. d. Average your answers to part a and b, and compare the result with your answer from part c. Will these always be equal for any two time periods? e. If the annual average rate of change for entire century continues, predict the number of immigrants in 2009. Compare answer to the actual number of 1,130,818 immigrants.arrow_forwardPopulation Growth and Decline The table gives the population in a small coastal community for the period 1997-2006. Figures shown arc for January 1 in each year. (a) What was the average rate of change of population between 1998 and 2001? (b) What was the average rate of change of population between 2002 and 2004? (C) For what period of lime was the population increasing? (d) For what period of time was the population decreasing?arrow_forwardLIFE SCIENCE APPLICATIONS Length of a Pendulum Grandfather clocks use pendulums to keep accurate time. The relationship between the length of a pendulum L and the time T for one complete oscillation can be determined from the data in the table. Source: Gary Rockswold. L(ft) T(sec) 1.0 1.11 1.5 1.36 2.0 1.57 2.5 1.76 3.0 1.92 3.5 2.08 4.0 2.22 a. Plot the data from the table with L as the horizontal axis and T as the vertical axis. b. Find the least squares line equation and graph it simultaneously, if possible, with the data points. Does it seem to fit the data? c. Find the correlation coefficient and interpret it. Does it confirm your answer to part b?arrow_forward
 Calculus For The Life SciencesCalculusISBN:9780321964038Author:GREENWELL, Raymond N., RITCHEY, Nathan P., Lial, Margaret L.Publisher:Pearson Addison Wesley,
 College AlgebraAlgebraISBN:9781305115545Author:James Stewart, Lothar Redlin, Saleem WatsonPublisher:Cengage Learning
 Algebra & Trigonometry with Analytic GeometryAlgebraISBN:9781133382119Author:SwokowskiPublisher:Cengage
 Functions and Change: A Modeling Approach to Coll...AlgebraISBN:9781337111348Author:Bruce Crauder, Benny Evans, Alan NoellPublisher:Cengage Learning