
Concept explainers
Videos
Population of Children The following table gives the estimated population (in millions) of U.S. boys age 5 and under and U.S. girls age 5 and under in selected years.
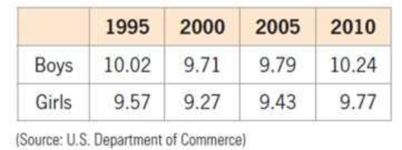
A function that models the population (in millions) of U.S. boys age 5 and under t years after 1990 is B(t) = 0.0076t2 – 0.1752t + 10.705, and a function that models the population (in millions) of U.S. girls age 5 and under t years after 1990 is G(t) = 0.0064t2 – 0.1448t + 10.12.
a. Find the equation of a function that models the estimated U.S. population (in millions) of children age 5 and under t years after 1990.
b. Use the result of part (a) to estimate the U.S. population of children age 5 and under in 2003.
Want to see the full answer?
Check out a sample textbook solution
Chapter 4 Solutions
College Algebra in Context with Integrated Review and Worksheets Plus MyLab Math with Pearson eText-- Access Card Package


- Table 6 shows the population, in thousands, of harbor seals in the Wadden Sea over the years 1997 to 2012. a. Let x represent time in years starting with x=0 for the year 1997. Let y represent the number of seals in thousands. Use logistic regression to fit a model to these data. b. Use the model to predict the seal population for the year 2020. c. To the nearest whole number, what is the limiting value of this model?arrow_forwardThe number of people afflicted with the common cold in the winter months dropped steadily by 50 each yearsince 2004 until 2010. In 2004, 875 people were inflicted. Find the linear function that models the number of people afflicted with the common cold C as a function of theyear, t. When will no one be afflicted?arrow_forwardHigh School Graduates The following table shows the number, in millions, graduating from high school in the United States in the given year. Year Number graduating in millions 1985 2.83 1987 2.65 1989 2.47 1991 2.29 a. By calculating difference, show that these data can be modeled using a linear function. b. What is the slope for the linear function modeling high school graduations? Explain in practical terms the meaning of the slope. c. Find a formula for a linear function that models these data. d. Express, using functional notation, the number graduating from high school in 1994, and then use your formula from part c to calculate that value.arrow_forward
- The US. import of wine (in hectoliters) for several years is given in Table 5. Determine whether the trend appearslinear. Ifso, and assuming the trend continues, in what year will imports exceed 12,000 hectoliters?arrow_forwardThe fox population in a certain region has an annualgrowth rate of 9 per year. In the year 2012, therewere 23,900 fox counted in the area. What is the foxpopulation predicted to be in the year 2020 ?arrow_forwardTable 2 shows a recent graduate’s credit card balance each month after graduation. a. Use exponential regression to fit a model to these data. b. If spending continues at this rate, what will the graduate’s credit card debt be one year after graduating?arrow_forward
 Functions and Change: A Modeling Approach to Coll...AlgebraISBN:9781337111348Author:Bruce Crauder, Benny Evans, Alan NoellPublisher:Cengage Learning
 Algebra & Trigonometry with Analytic GeometryAlgebraISBN:9781133382119Author:SwokowskiPublisher:Cengage
 Algebra and Trigonometry (MindTap Course List)AlgebraISBN:9781305071742Author:James Stewart, Lothar Redlin, Saleem WatsonPublisher:Cengage Learning
 Big Ideas Math A Bridge To Success Algebra 1: Stu...AlgebraISBN:9781680331141Author:HOUGHTON MIFFLIN HARCOURTPublisher:Houghton Mifflin Harcourt